
Arctic sea ice extent is the highest in the past thirteen years and sixth highest this century.
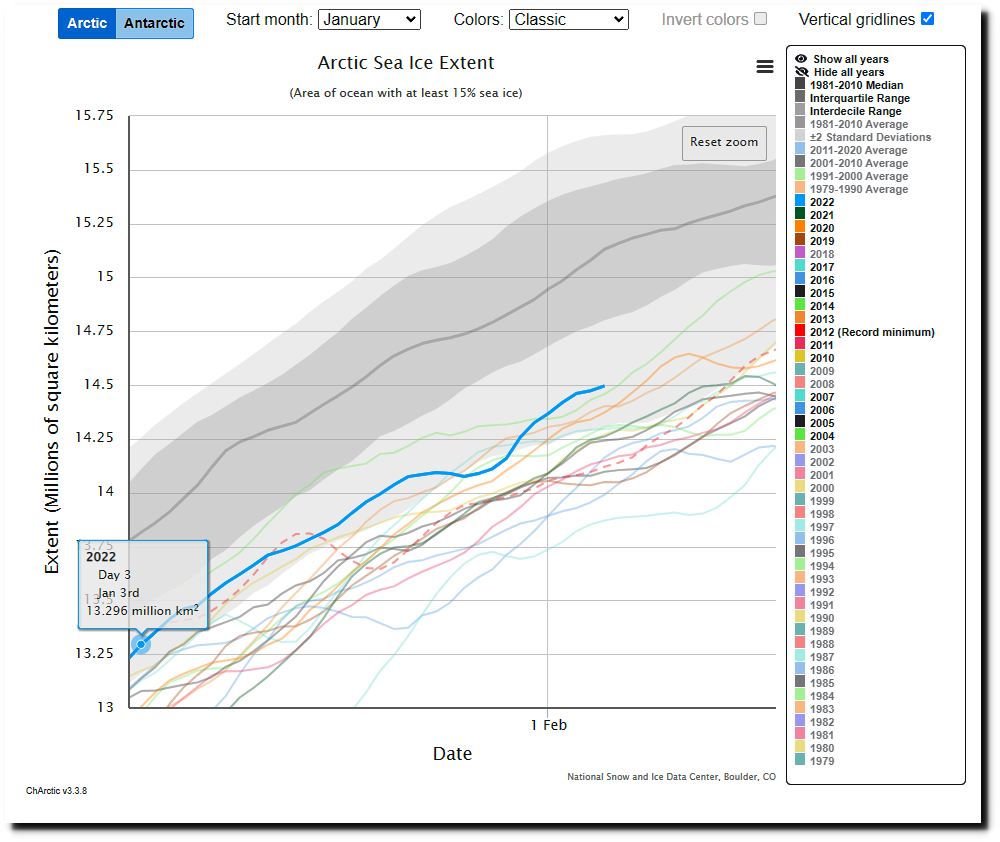
Charctic Interactive Sea Ice Graph | Arctic Sea Ice News and Analysis
NSIDC reports this as “sixteenth lowest in the satellite record”
“January 2022 finished as the sixteenth lowest extent in the satellite record”

Arctic sea ice this January: so last decade | Arctic Sea Ice News and Analysis
In other words, they had no idea what they were talking about fifteen years ago.
Star-News – Google News Archive Search
Using their cherry-picked start point of 1979, they say January Arctic sea ice extent is declining at 42,800 sq. km./year.

Arctic sea ice this January: so last decade | Arctic Sea Ice News and Analysis
This is down from four years ago when they reported 47,700 sq. km./year.

Sea ice tracking low in both hemispheres | Arctic Sea Ice News and Analysis
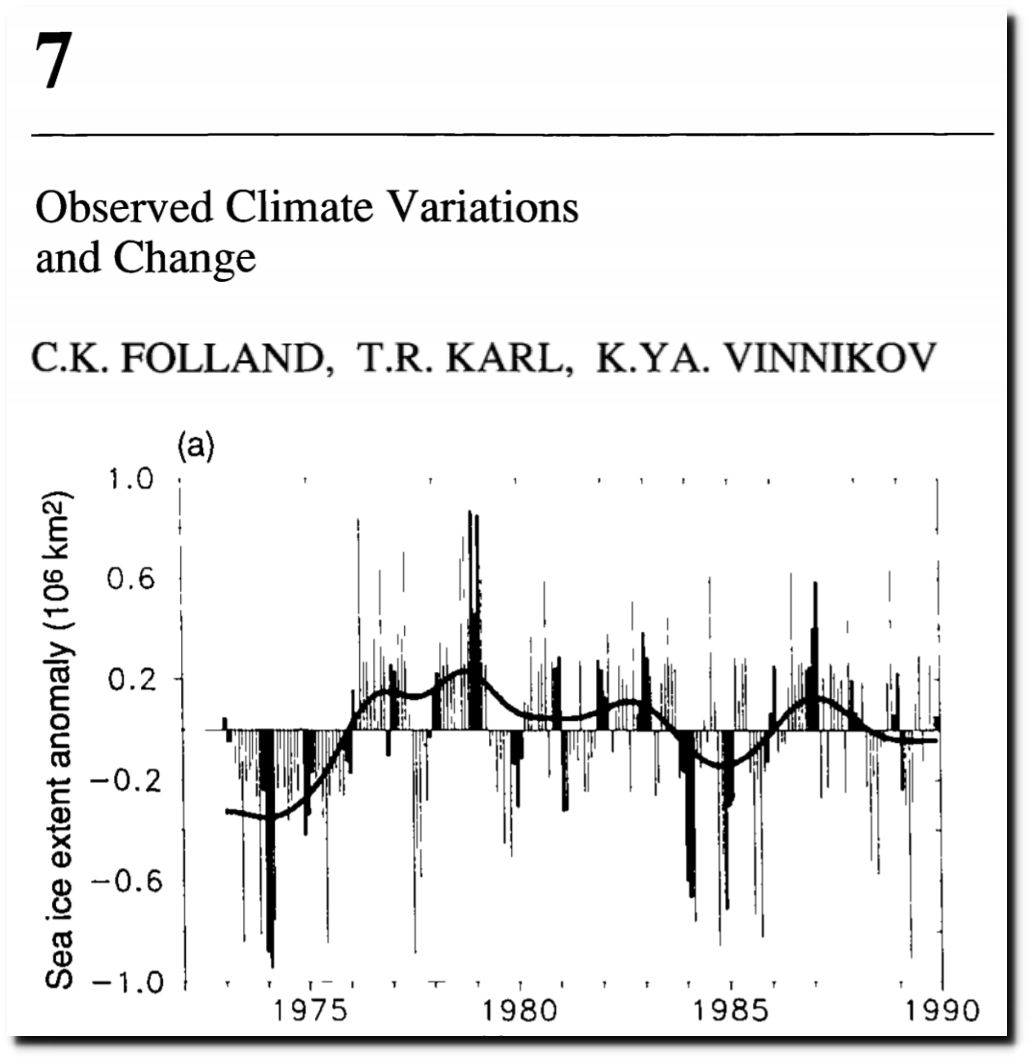
NSIDC also hid all the inconvenient satellite data prior to 1979.
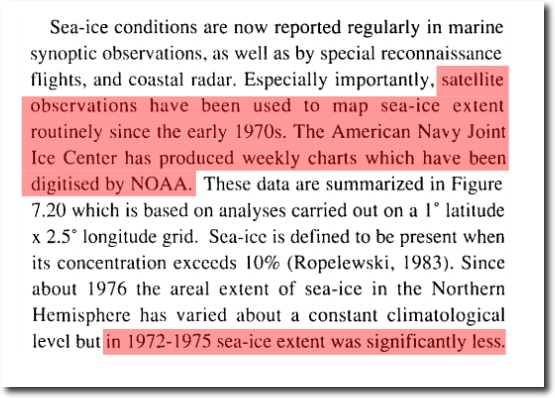
“The American Navy Joint Ice Center has produced weekly charts which have been digitised by NOAA ….. Since about 1976 the areal extent of sea-ice in the Northern Hemisphere has varied about a constant climatological level but in 1972-1975 sea-ice extent was significantly less.
They hid the low ice extent and volume from the 1950s.
 Projecting the climatic effects of increasing carbon dioxide
Although the idea that a solid ice sheet covers the central Arctic has lingered stubbornly in the popular fancy, the northern cap of ice worn by our planet is actually a thin crust—on the whole, only about seven feet thick—over an ocean two miles deep in places.

The Changing Face of the Arctic; The Changing Face of the Arctic – The New York Times
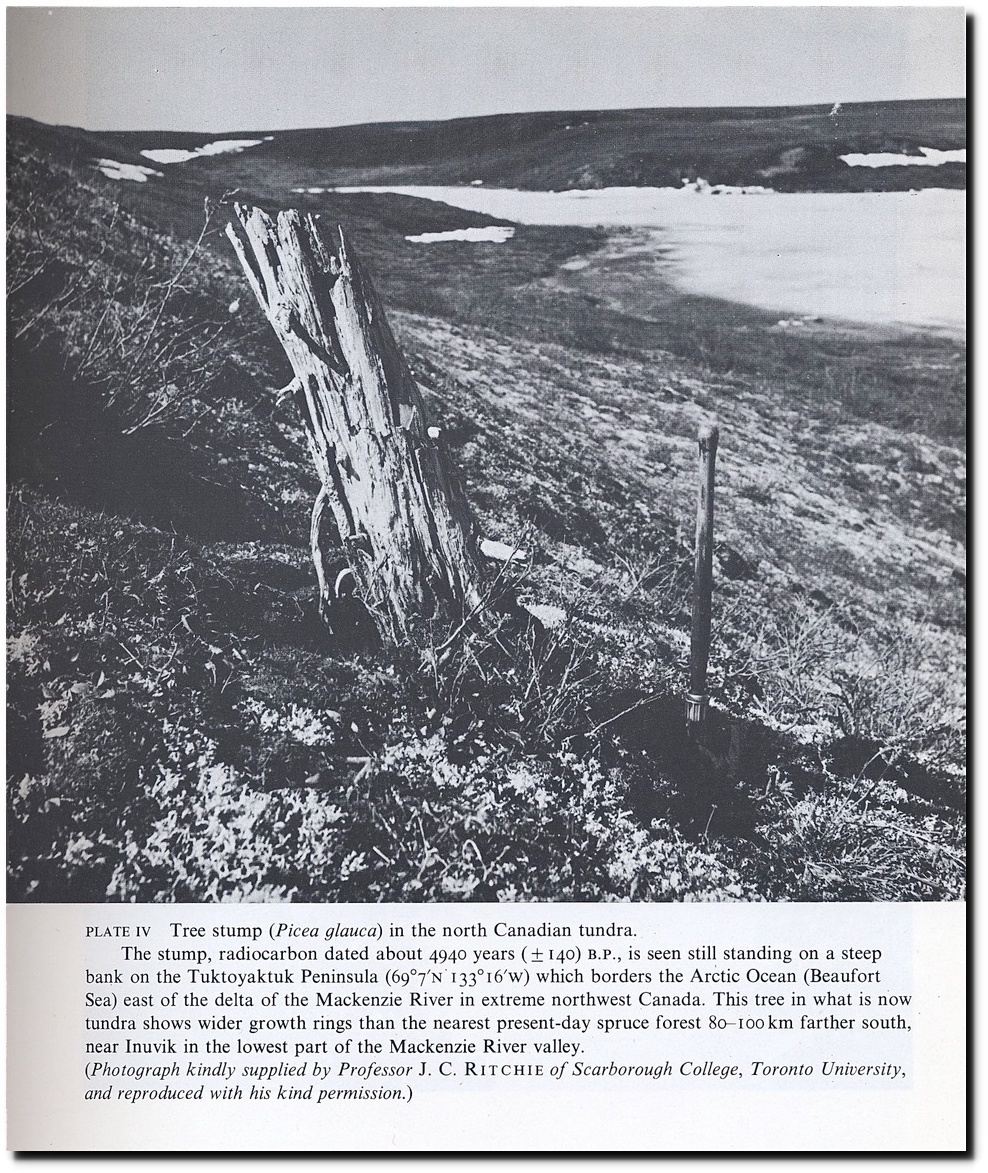
And no mention of the fact the Arctic was ice-free 6,000 years ago.
Less Ice In Arctic Ocean 6000-7000 Years Ago — ScienceDaily
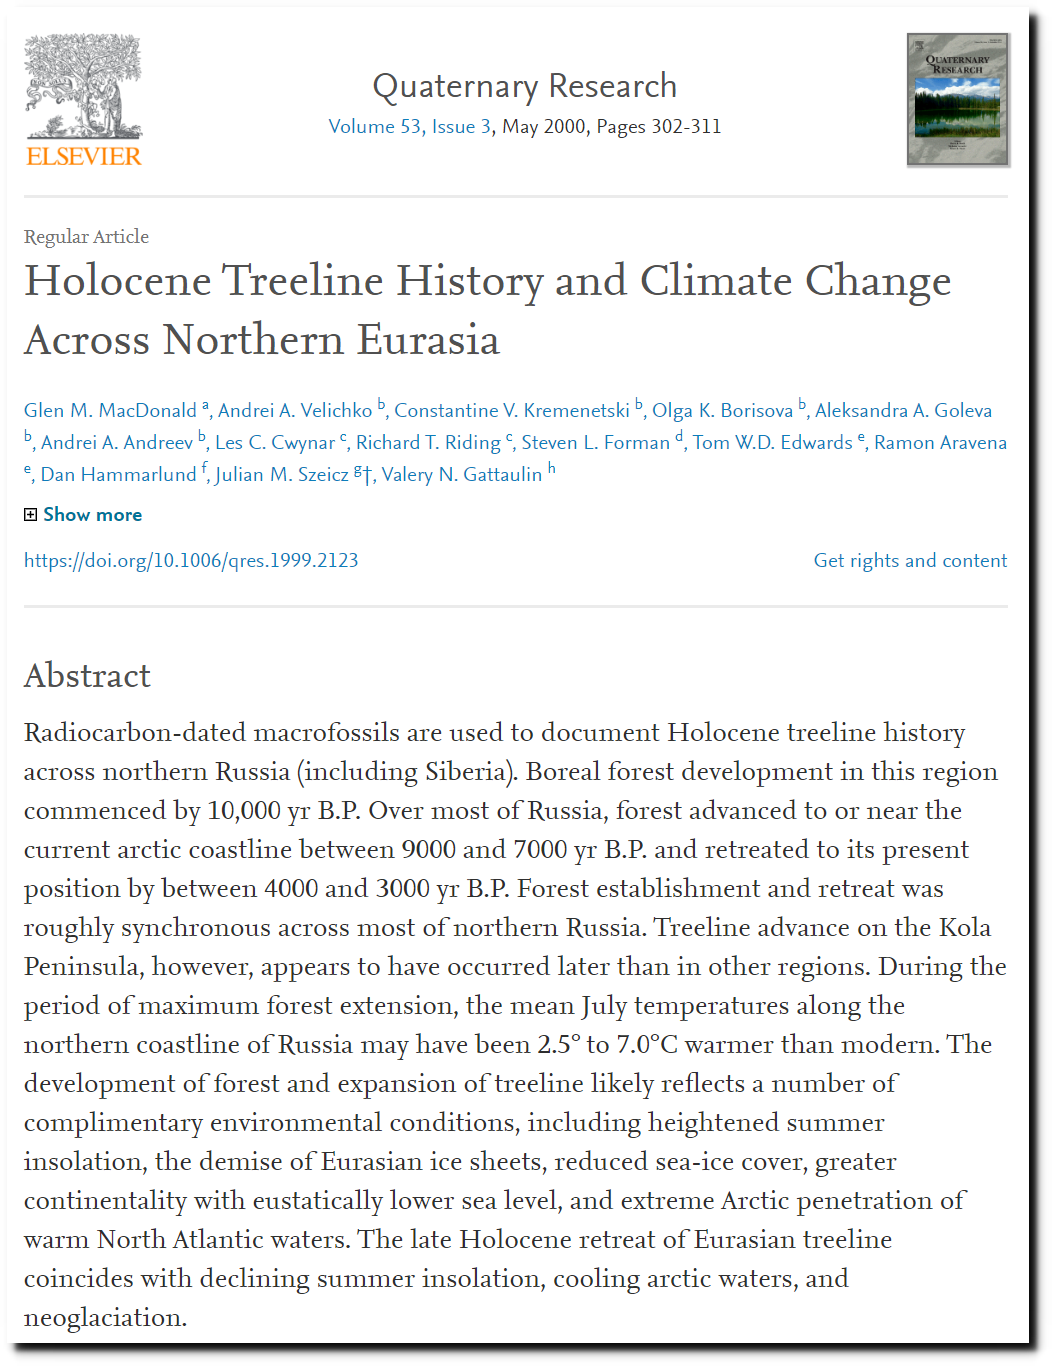
Holocene Treeline History and Climate Change Across Northern Eurasia – ScienceDirect
Eight years ago NSIDC said surface melting of Greenland’s ice sheet is one sign of climate change.
What is under Greenland’s ice? | National Snow and Ice Data Center
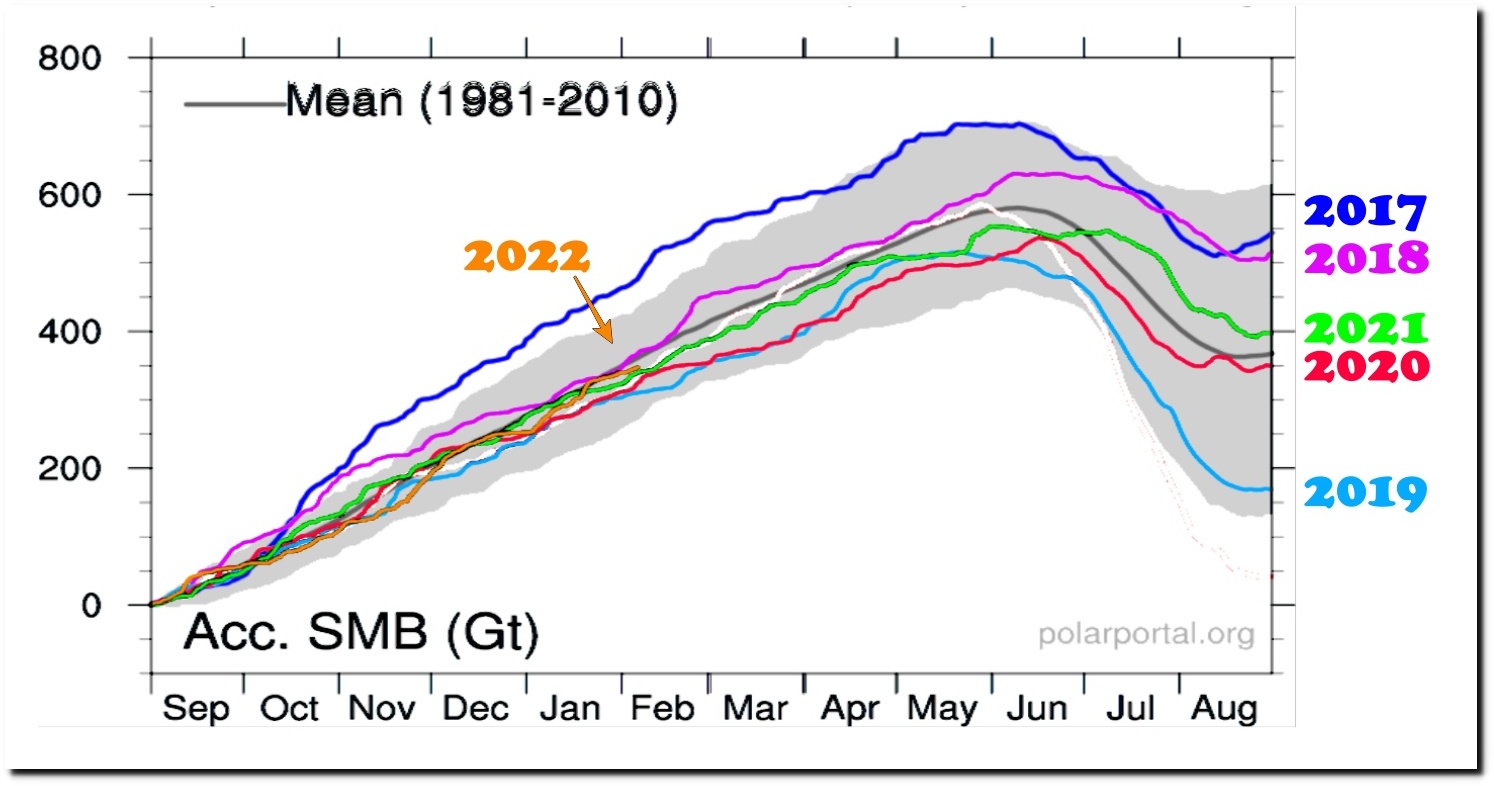
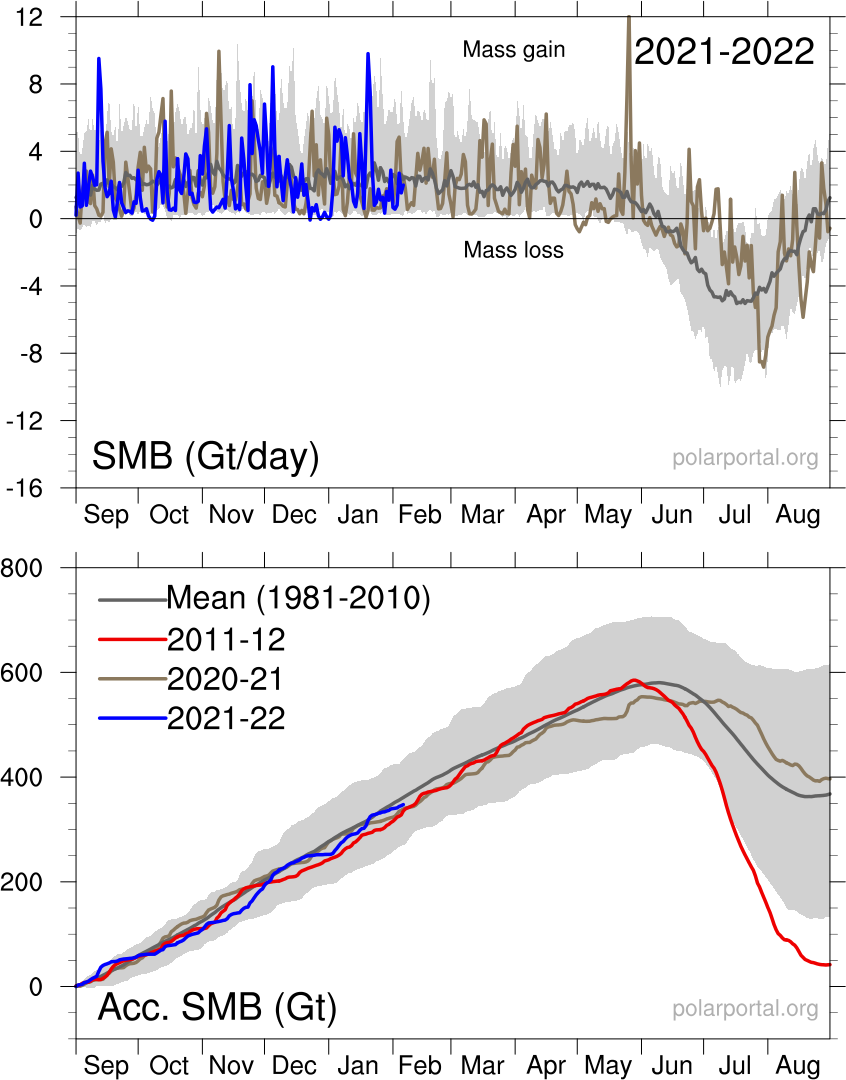
Greenland’s surface mass balance has been well above the 1981-2010 average over the past six years, with inly one year significantly below the mean.
