“sixteenth lowest extent”

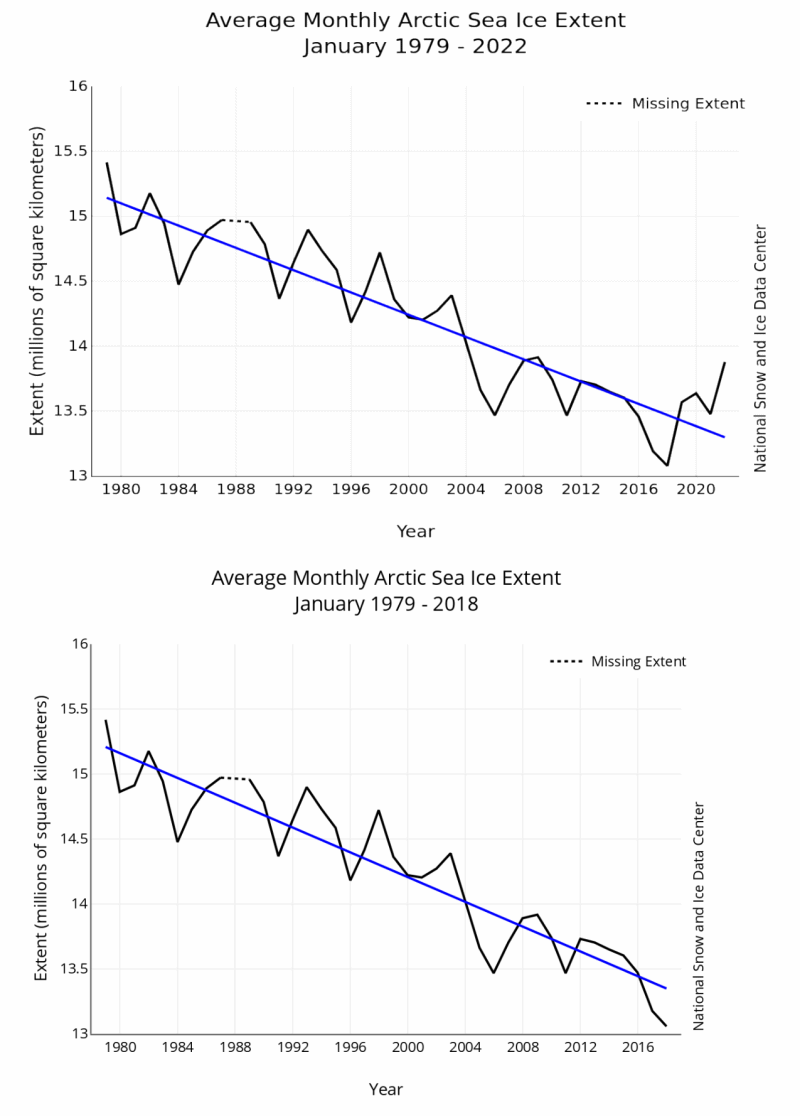
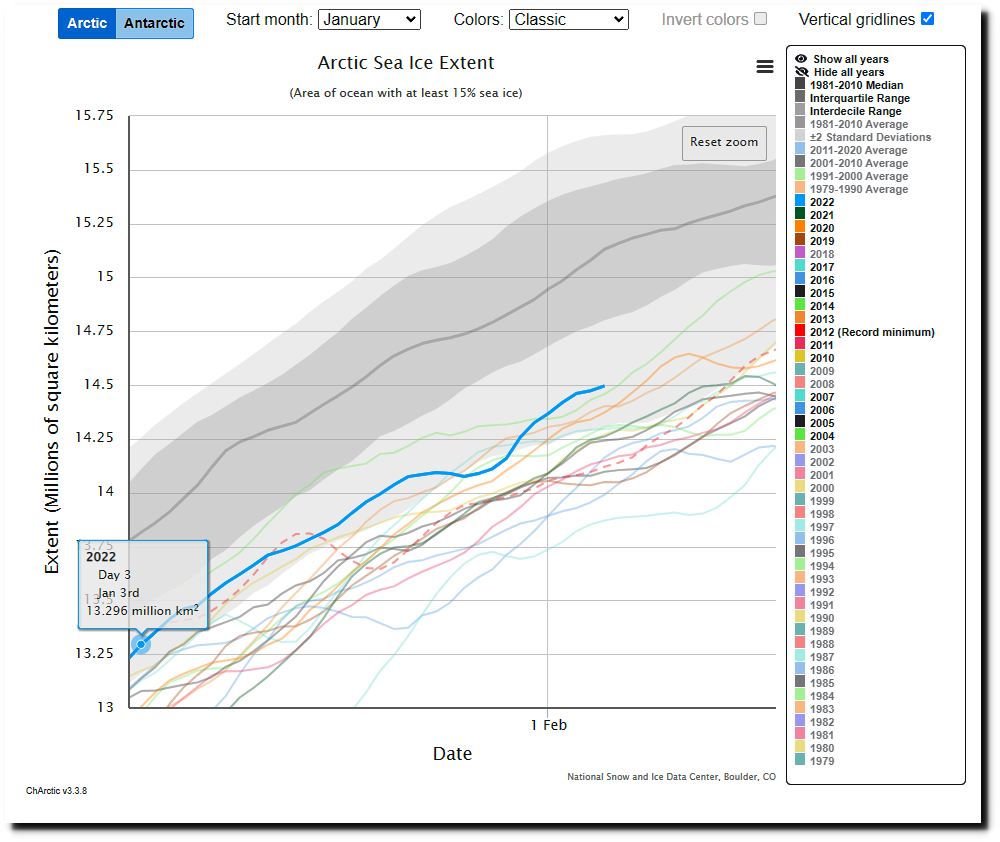
Arctic sea ice extent is the highest in the past thirteen years and sixth highest this century.

Charctic Interactive Sea Ice Graph | Arctic Sea Ice News and Analysis

NSIDC reports this as “sixteenth lowest in the satellite record

“January 2022 finished as the sixteenth lowest extent in the satellite record”

Arctic sea ice this January: so last decade | Arctic Sea Ice News and Analysis

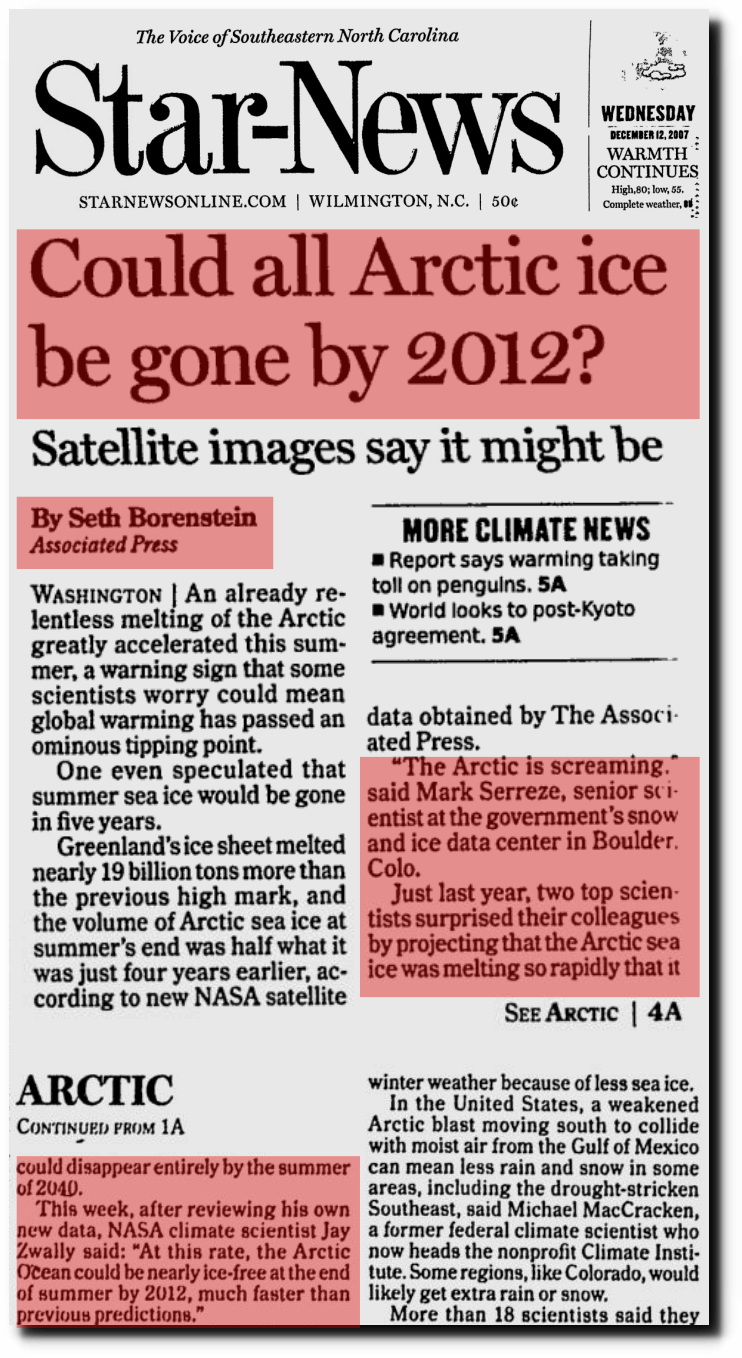
In other words, they had no idea what they were talking about fifteen years ago.

Star-News – Google News Archive Search

Using their cherry-picked start point of 1979, they say January Arctic sea ice extent is declining at 42,800 sq. km./year.

Arctic sea ice this January: so last decade | Arctic Sea Ice News and Analysis

This is down from four years ago when they reported 47,700 sq. km./year.

Sea ice tracking low in both hemispheres | Arctic Sea Ice News and Analysis

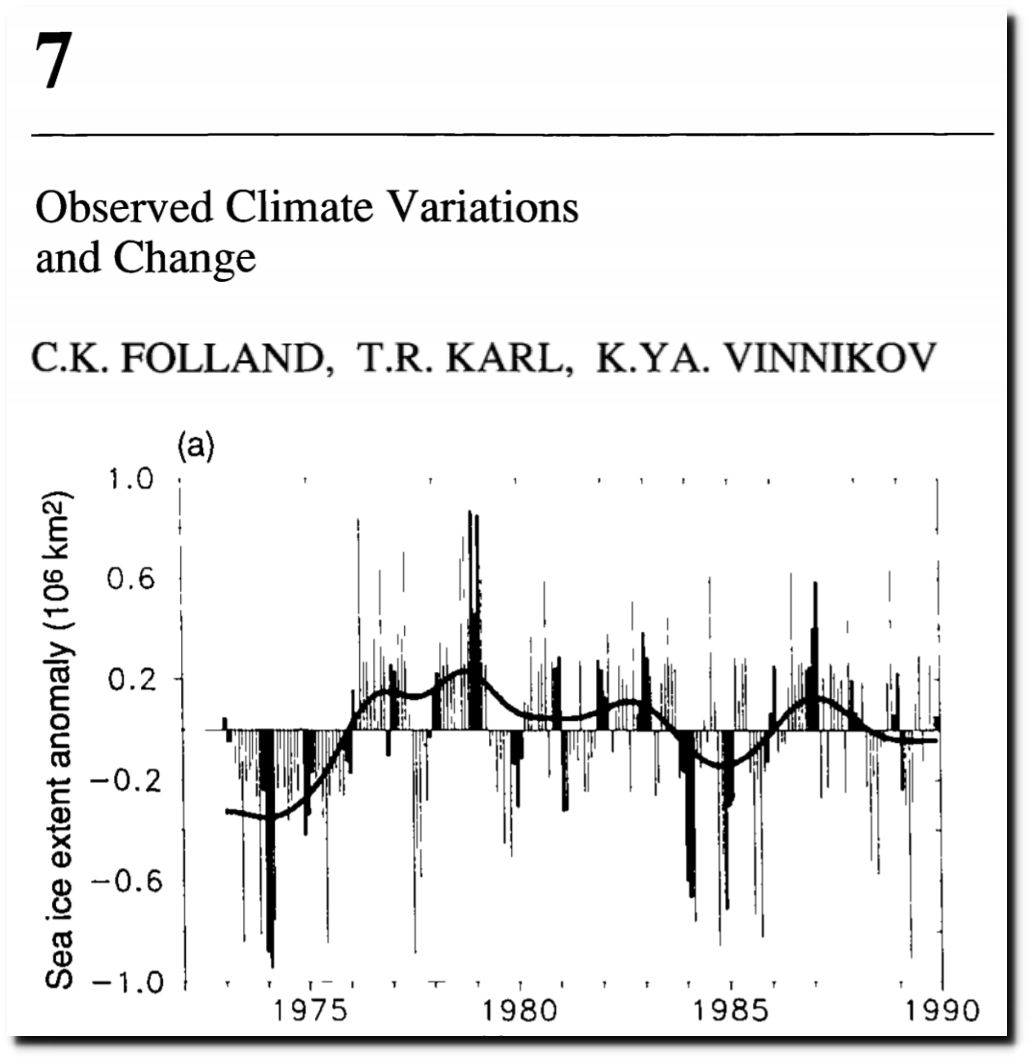
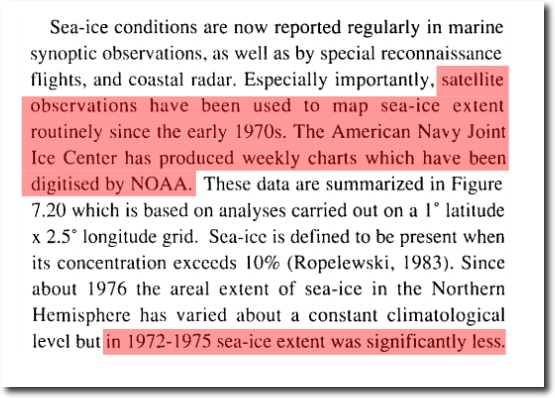
NSIDC also hid all the inconvenient satellite data prior to 1979.

“The American Navy Joint Ice Center has produced weekly charts which have been digitised by NOAA …..  Since about 1976 the areal extent of sea-ice in the Northern Hemisphere has varied about a constant climatological level but in 1972-1975 sea-ice extent was significantly less.

1990 IPCC Report

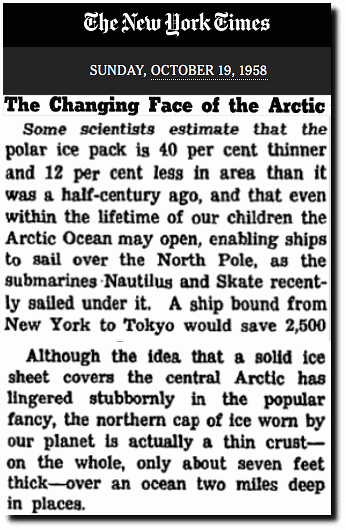
They hid the low ice extent and volume from the 1950s.
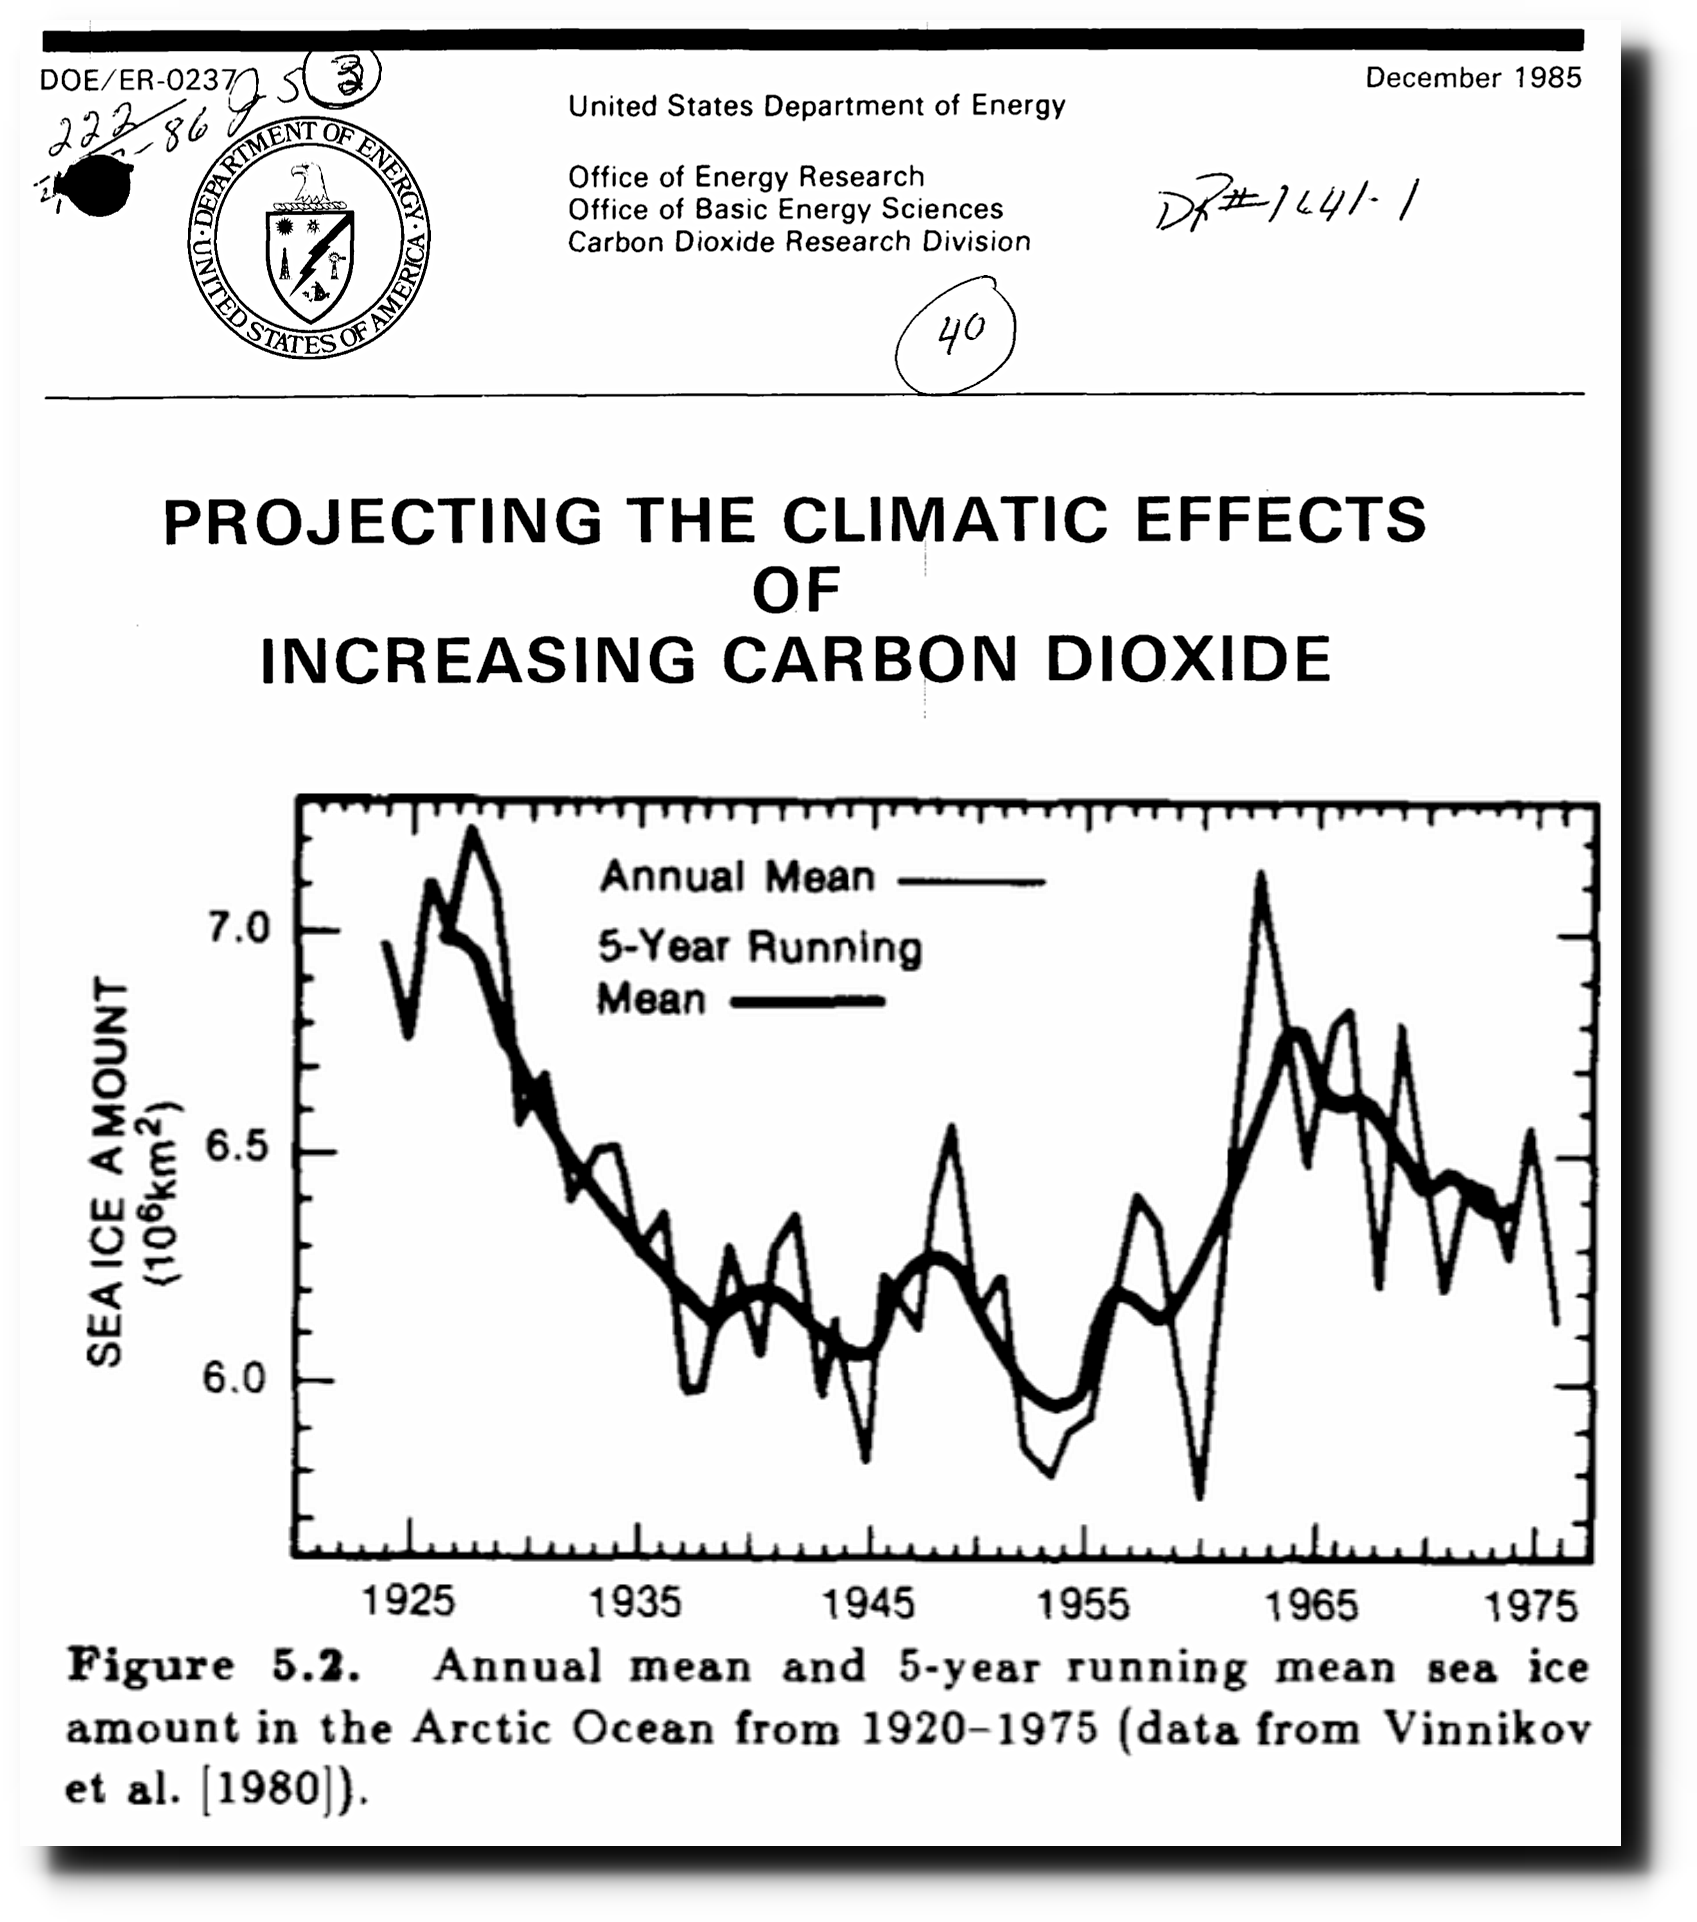
Projecting the climatic effects of increasing carbon dioxide 

Although the idea that a solid ice sheet covers the central Arctic has lingered stubbornly in the popular fancy, the northern cap of ice worn by our planet is actually a thin crust—on the whole, only about seven feet thick—over an ocean two miles deep in places.

The Changing Face of the Arctic; The Changing Face of the Arctic – The New York Times

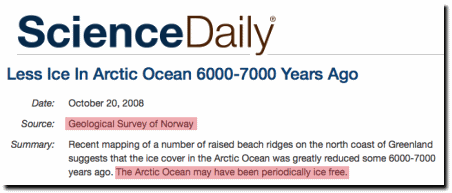
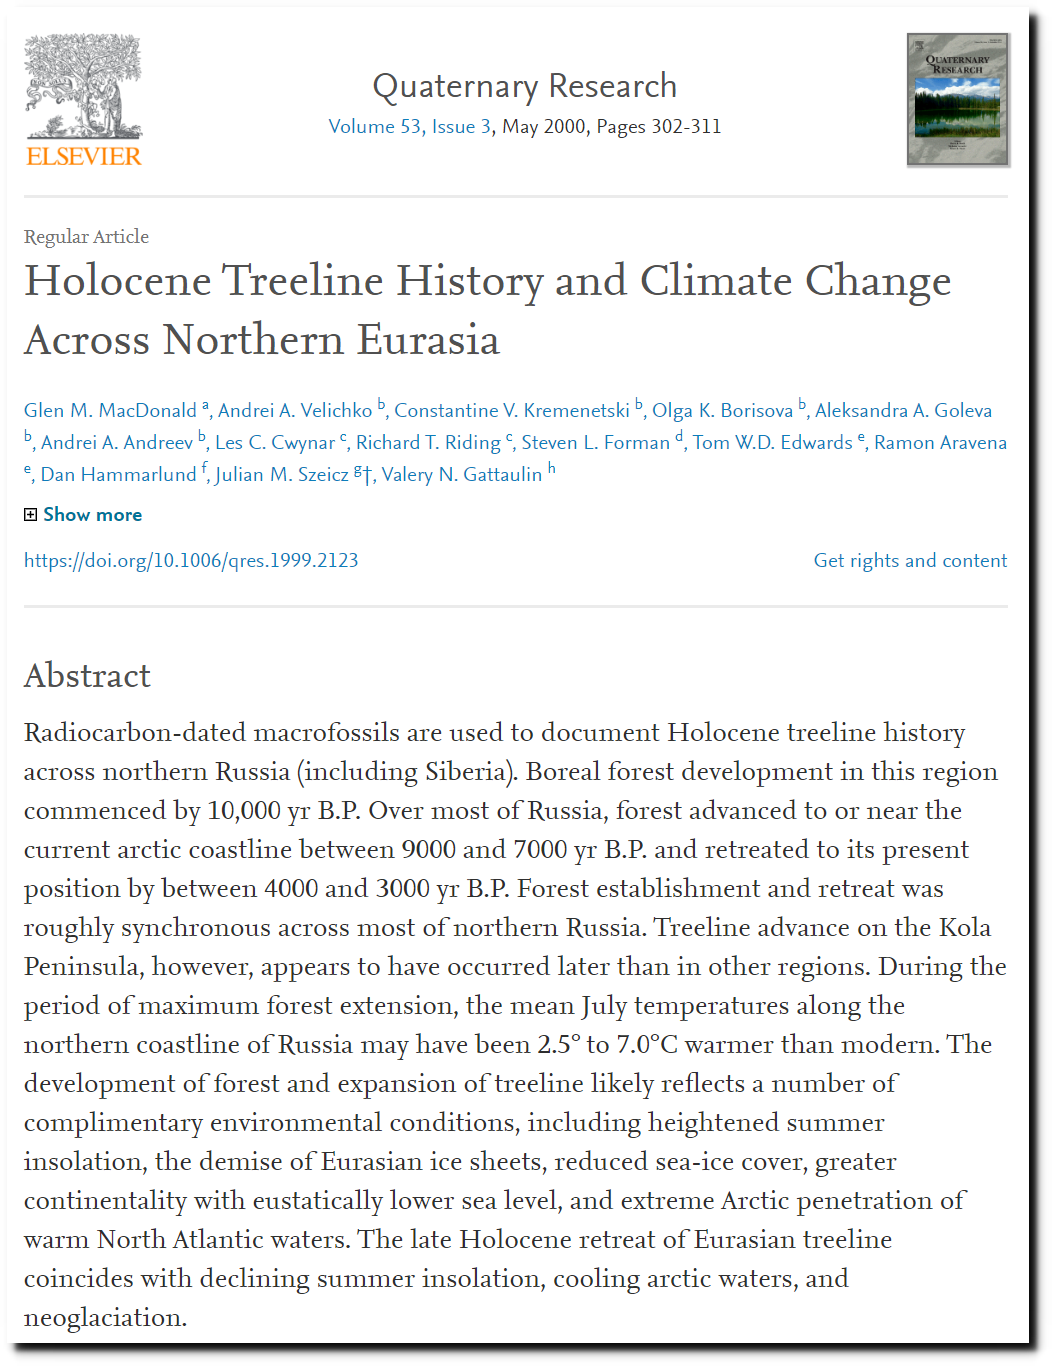
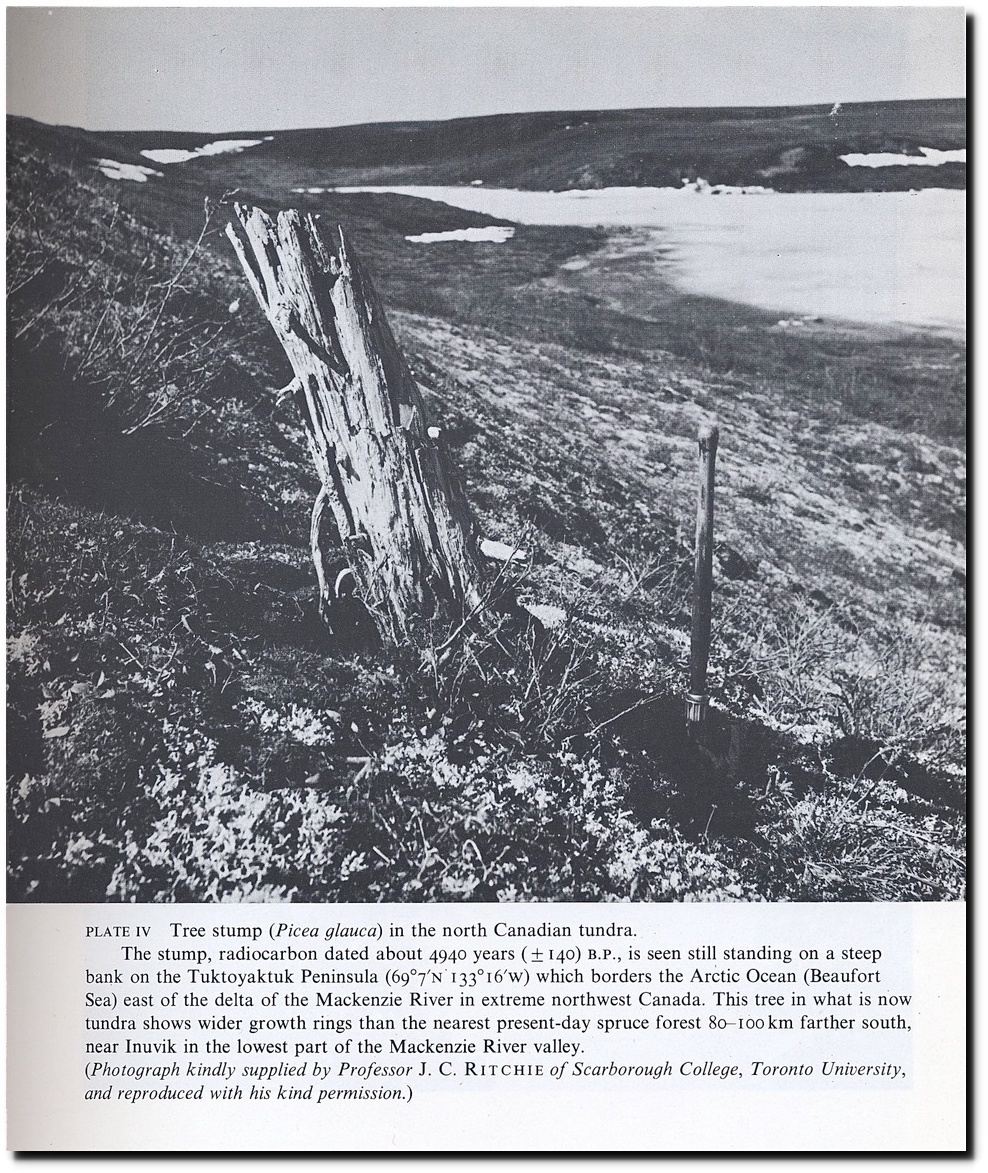
And no mention of the fact the Arctic was ice-free 6,000 years ago.

Less Ice In Arctic Ocean 6000-7000 Years Ago — ScienceDaily

Holocene Treeline History and Climate Change Across Northern Eurasia – ScienceDirect

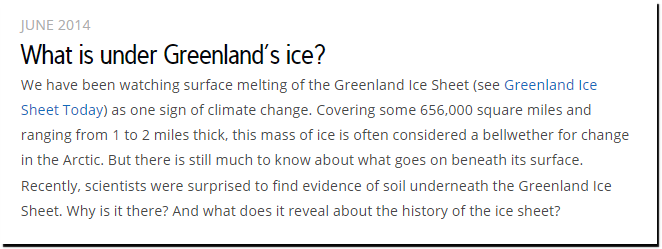
Eight years ago NSIDC said surface melting of Greenland’s ice sheet is one sign of climate change.

What is under Greenland’s ice? | National Snow and Ice Data Center

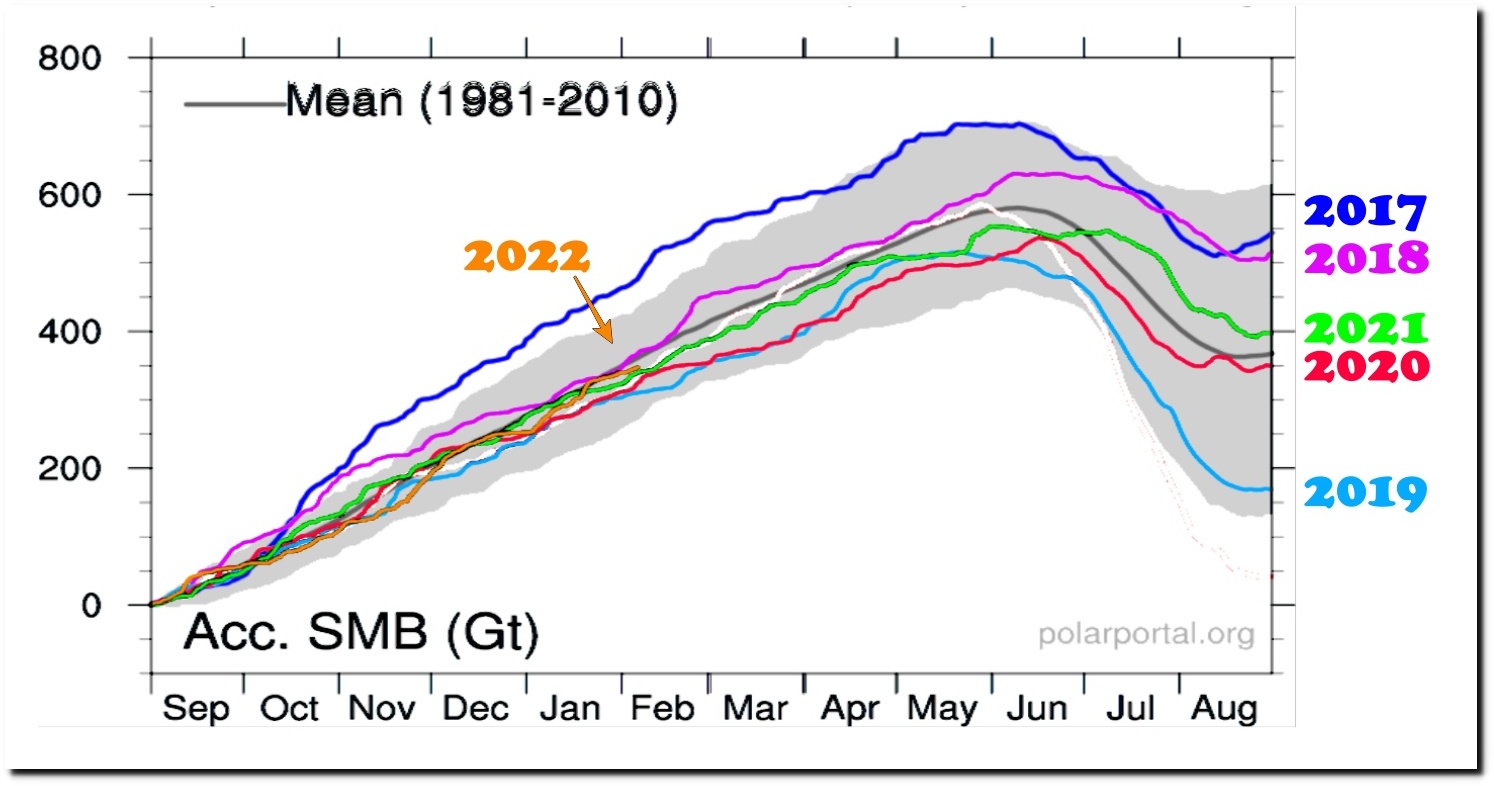
Greenland’s surface mass balance has been well above the 1981-2010 average over the past six years, with inly one year significantly below the mean.

SMB_curves_LA_EN_20220206.png (846×1080)

This entry was posted in Uncategorized. Bookmark the permalink.

12 Responses to “sixteenth lowest extent”

  1. Jack the Insider says:

    Bloody hell, someone better tell the Russian ice breaker manufacturers about this shocking evidence to stop building those ever bigger breakers.

    • arn says:

      I heard that russians are pissed that they can not keep the routes open because sea ice extent was the 99th lowest of the last 100years.

  2. jb says:

    I have a question re: surface mass balance.
    If it is always above zero, does this mean that the ice is getting greater (there is more and more ice accumulating?)?

    • tonyheller says:

      The excess ice flows back into the sea as glaciers.

      • GWS says:

        But the chart suggests it’s always on the increase. That WWII bomber that landed in Greenland was under 200 feet of snow after a few decades. Where is it all coming from? And yet the oceans continue to rise. Is more water coming from space as many believe?

        • Steve says:

          The oceans are not rising. Well, OK, not to an extent that is measurable and definitive. Why do you think Barry and Big Mike bought a mansion on Martha’s Vineyard, that is maybe 10 or 15 feet above sea level, and Pelosi bought a FL mansion that is not much higher, if at all. They know something they do not want us “plebes” to know. Watch what the ones who are in control do, not what they say.

  3. Conrad Ziefle says:

    Given what we know from the data you have shared with us, 1981 to current year is a selective set of data that purposely hides the early 1970s satellite data. I think, to be fair, you have to do something with the data collected before satellites, too, if you want to talk about climate vs weather. Anyway, their statement is sour grapes, and childishly deceptive. 16th lowest year in the data set that they have chosen, 44 years, puts it 6 years below the median year, which may not be the mean, but we can guess that that puts the current year within one standard deviation of the mean of their selective data set. Looking at the first graph, we would be off by a little bit. It actually is about 1.5 standard deviations from the mean shown in the first graph. The last graph puts it even closer. I’ve always had trouble with the first graph. It looks like the mean and standard deviations are shifted upward with respect to the colored annual lines. The last graph seems to agree with me. Anyway, or either way, 16th lowest out of 44 is not alarming, and all you have to do is think about it.

  4. Steve says:

    Now add to this that Antarctic ice volume is 1000 larger than Arctic+Greenland, and has, per Zwally’s NASA-sponsored work, been increasing since the satellites went up in ’72, and well, you have a VERY inconvenient truth. The price all of humanity pays for not prepping for a mini-ice age because of this bad, dishonest “science”, will be enormous. We can see humans are rushing headlong into a catastrophe made much worse by their own stupidity. This will make covid look like child’s play…

  5. Steve says:

    Also please note that “they” switch between extent and volume depending on what data helps their warming narrative the most. Extent is a poor substitute for volume, but much easier to measure.

    • Conrad Ziefle says:

      I thought it was more like ten x bigger, i.e. 1000% nor 1000x, but I thought I should check before saying anything. So I thought I could put the question into the google search engine and the answer would pop right up. Instead, I got all of these “the sky is falling” references, then finally one from a NASA 2015 report which said that the Antarctic ice was growing faster than all the other ice in the world combined are losing. I had to pull an old Atmospheric Science text book off the shelf to find the answer.
      The google search engine is propaganda crap, probably rose to the top under the influence of that Schwab great reset guy and his cohorts.
      People are talking about all the new conservative social media, and other internet stuff. We certainly need an alternative, and the thing is, it needs to be open to everyone, plus have cool bells and whistles that are fun and attract people. Also, easy to link with all your old contacts, etc. I know, I keep saying it. I keep hoping someone can do something about it.

  6. oeman 50 says:

    Interestiing. That Chapter 7 from the 1990 IPCC report lists “T.R. Karl” as one of the authors. If I am not mistaken, he later on “normalized” seawater temperature data from the Argo system to the historical temperature using ship data, much less accurate. Guess what, it gives higher readings than the Argo data.

  7. Kevin P says:

    Recently the January sea ice extent appeared to be reaching the mean, and then magically the data was taken offline fir a few days to upload a new version of the model. Of course the new model reset the 2022 trend line to the bottom of the standard deviation range. Now it’s looking like they’re going to have to take this chart offline again soon for the second time this winter.

Leave a Reply to arn Cancel reply

Your email address will not be published. Required fields are marked *