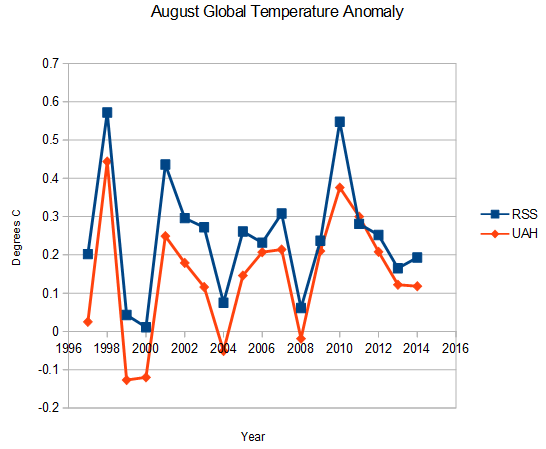
Contrary to the spectacular “hottest August ever” lies being propagated by NASA GISS and NOAA ahead of Obama’s climate conference – August was the coldest in five years and the second coldest in 10 years, according to far more accurate NASA satellite data.
www.woodfortrees.org/data/rss/from:1997/plot/uah/from:1997/plot/gistemp/from:1997


http://www.youtube.com/watch?v=sh93oEqBHbY
Second coolest isn’t going to get enough hype. I have no trust in the observations of climate modellers. They don’t ever want to be proven wrong.
They belong in the Matrix, where reality comes from machines.
I wonder if the frog in the water bath that keeps getting warmer has been tried the other way, getting colder. One year the temps fell very slowly. Ever week I was out washing and waxing the car. It was a surprise when the water was turning to ice on the side of the car. While we can adapt to colder weather, other things cannot. Water always freezes whether we believe it is cold or not. And plants will not produce at temps below what is required for them to set. There were no tomatoes this year where we live. On paper you can make the numbers look like anything you want. The fact remains that it was a very cool summer. The tomatoes and other poorly preforming crops say so. NASA is in direct conflict with reality.
Yea, it is called hard water – just ask Gavin.
Here in Santa fe..it was 10 degrees lower than last yr. We had one day 91 degrees and never hit 100. Yet the libs here are yelling we are getting warmer. They get their source from our one paper which is owned by AP a big one sided global warming source.
Record lows this morning in the Northeast…
http://www.mychamplainvalley.com/story/d/story/record-low-temperatures-set-friday/21218/KKeUNOxCbUGLkwgjMRdF_Q
There was a great post back in August 27, 2013
http://stevengoddard.wordpress.com/2013/08/27/mildest-summer-in-a-century-in-the-us/
Is there any chance we can see the updated chart to include this year?
Wow! I came across it yesterday in newspaper and wondering what to make of it. 🙂
*face palm* Fluctuations year to year don’t define long term climate patterns.
Climate IS weather, over an ARBITRARY period of time, for a given area/region.
Guys, I am with you all day long. Really, but what’s with the graph? It indicates that temps have been warmer for the vast majority of the last 19 years.
17 years, actually
Given the error margin, aren’t all those temperatures basically the same?
Error margin…what’s that?
/sarc