
Dana is unhappy about 60% growth in the Arctic summer minimum sea ice extent, area and volume over the past two years – so he published these graphs which show Arctic ice falling off a cliff
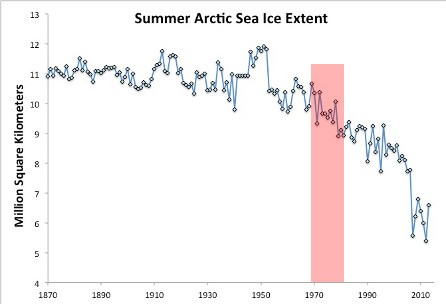
Note that he cleverly left off the huge increase since 2012, and the second graph shows a sharp decrease from 1970 to 1979, which is in direct contradiction to satellite data from the 1990 IPCC report – which showed a 2 million km² increase from 1974 to 1979.
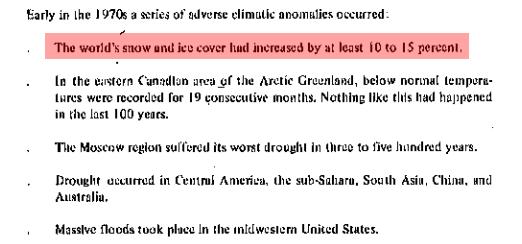
But Dana’s BS is worse than it seems. The CIA reported in 1974 that the ice had already increased 10-15% by 1974, which is again shown the opposite on Dana’s graph
Amundsen said the Northwest Passage was open in 1904, and it wasn’t in 2014
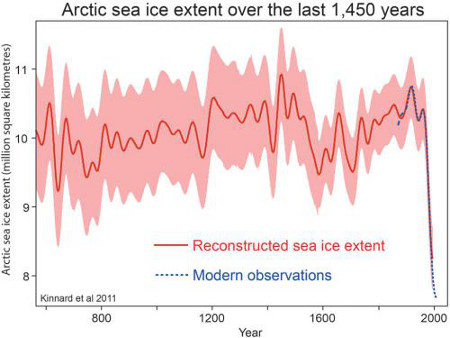
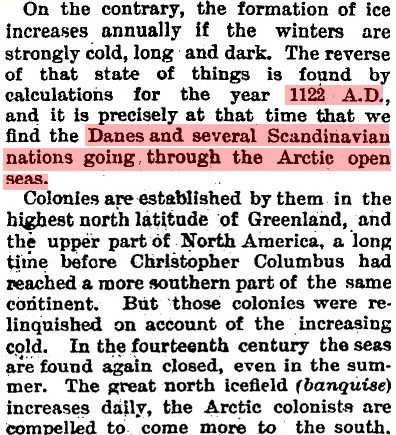
And Dana’s other fake graph somehow missed the fact that the Vikings traveled through open Arctic seas in the year 1122. The top graph shows almost 50% more ice around that time period.
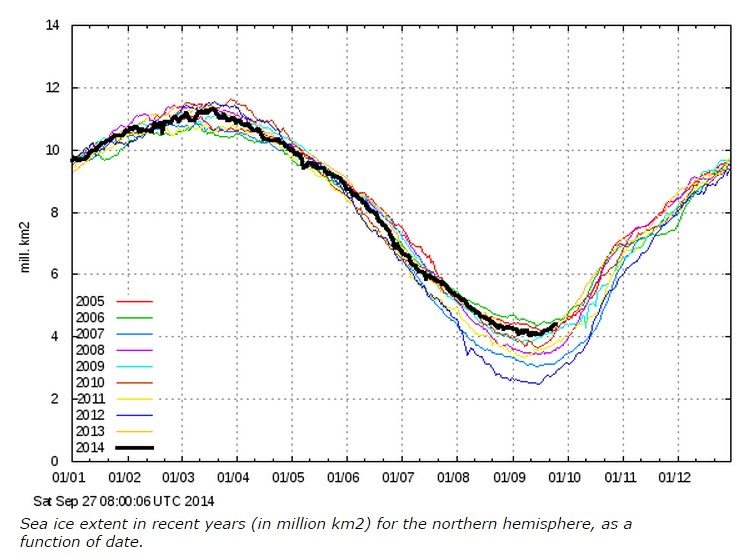
Dana slimed his readers at so many different levels, that it must have been written by him. Arctic ice extent is second highest in the past decade.
 COI | Centre for Ocean and Ice | Danmarks Meteorologiske Institut

To see how ridiculous those 11M km2 summer sea ice extent charts are, here is 11.3M km2 of Arctic sea ice from June 2014.
ftp://sidads.colorado.edu/DATASETS/NOAA/G02135/Jun/N_201406_extn.png
Where did he get these? He has1945 to 50 at almost 12 million. Maybe that is the NH extent during the SH summer?
It’s the NH summer, and it’s completely bogus, especially given the ability to sail the NW passage during those times; they have enough trouble now. Note also there’s no source provided for the data that the graph is based on.
The first graph uses Mikey’s Nature trick, and you can drive the Titanic through the error bars.
David,
IIRC, those charts are available from UIUC’s Cryosphere Today site. I think they were on a Tamino post a few years ago too.
But they’re patently false IMO now. My evidence is that we now have a satellite (from Nimbus) number for the 1964 Arctic minimum which places it no different than a mid-1980’s value, unlike this plot that shows it 15-25% higher in the early 60’s.
-Scott
Dana does not actually know sea ice extent over the past 1,450 years.
All true climate science has a hockey stick.
This “science” has a hockey stick.
Therefore, this is True Climate Science™.
Reblogged this on Canadian Climate Guy and commented:
Nuttercelli is at it again. How do these climate clowns sleep at night?!
The Vinland Map shows the north coast of Greenland rather well, so someone must have sailed along that coast before 1440. During the 20th century that coast is icebound year round.
See http://www.amazon.com/Vinland-Map-Tartar-Relation-New/dp/0300065205/ref=la_B001H6U600_1_1?s=books&ie=UTF8&qid=1411823792&sr=1-1
To find out exactly how one estimates arctic sTo find out exactly how one estimates arctic sea ice extent over the past 1450 years (the first graph), I Googled Kinnard, et al. 2011. It’s paywalled by the world’s largest producer of bird cage liners, ‘The Journal Nature’. But the references are visible, and include works by some of the finest Witch Doctors of Climastrology:
Mann, M. Climate over the past two millennia.
Mann, M. E. et al. Proxy-based reconstructions of hemispheric and global surface temperature variations over the past two millennia.
Jones, P. & Mann, M. Climate over past millennia.
Jones, P. D. et al. High-resolution palaeoclimatology of the last millennium: a review of current status and future prospects.
Cook, E. R., D’Arrigo, R. D. & Mann, M. E. A well-verified, multiproxy reconstruction of the winter North Atlantic Oscillation index since A.D.?1400.
Crespin, E., Goosse, H., Fichefet, T. & Mann, M. The 15th century Arctic warming in coupled model simulations with data assimilation.
Cook, E., Briffa, K. & Jones, P. Spatial regression methods in dendroclimatology: a review and comparison of two techniques.
Wahl, E. & Ammann, C. Robustness of the Mann, Bradley, Hughes reconstruction of Northern Hemisphere surface temperatures: examination of criticisms based on the nature and processing of proxy climate evidence.
Serreze, M. C., Holland, M. M. & Stroeve, J. Perspectives on the Arctic’s shrinking sea-ice cover.
I decided not to spend $32 to read it.
I’m not real sure I’d read it if you paid me $32. I can get more believable fiction in the paperback Sci Fi section of the bookstore for $7.95 plus tax.
Heck, you can most of it for your Kindle for $2…
Guardian readers can’t be slimed any more than they already are to begin with.
They’re already comatose !
The world ended in 2000? Damn! Missed it again.
Aha Mike nature trick
There you go, cherry-picking the entire data set again!
He strikes me as a boy trying to be heard. Saying whatever will accomplish that.
+10!
Everyone – didn’t you get the memo from the Climate Industry? Since ice *extent* and *area* are now increasing, it is now the ice *volume* that we should be worried about. Got it??
(And yes we know **exactly** how much ice was in the arctic since 1492, to a resolution of +/- 1 cm^3. Three cheers for the PROXIES!).
Proxies are the pixies of climate science.
+10
Can I use that one? I like it!
Historical Arctic sea ice extents have been a big question mark so it would be interesting to see a dissection of Kinnard 2011, the chart looking suspiciously like an inverted hockey stick. Assuming to be proxy derived, and considering the atrocities inflicted upon proxy data by noble cause driven scientivists, I assume a sleight of data in achieving said chart until persuaded otherwise.
Kinnard et al. show less Arctic ice during the LIA. The current drop off in extent must mean that the next glaciation has already started!
They have a cultish devotion. Notice how the definition of a cult fits so well with these fanatics:
“A cult is a group or movement exhibiting great or excessive devotion or dedication to some person, idea, or thing, and employing unethical manipulation or coercive techniques of persuasion and control (e.g., isolation from former friends and family, debilitation, use of special methods to heighten suggestibility and subservience, powerful group pressures, information management, suspension of individuality or critical judgment, promotion of total dependency on the group and fear of leaving it), designed to advance the goals of the group’s leaders,”
Its the “cause” that has to be focused on. It was the fierce defence and the alienation of opposing views that waved a red flag at me some 10 years ago. I realized that it wasn’t science but something else that was motivating them. Now, blatant lies are not even questioned by the “members”.
And you can’t leave out the treatment of ex-members or those who disagree with the ‘teachings’ of the ‘masters’…
I like the term “scientivist” . Maybe some cold! day the word scientist can have its integrity back. The scientists with ethical underpinnings are seemingly so outnumbered these days. It is a little like the current use of “pollutant” regarding carbon and Carbon dioxide. As a carbon based life form depending on healthy plants for the air I breathe, I am offended by present day politics. We won’t dignify this by calling it science, so maybe there is another use for scientivism!
Another thought: I really appreciate the highly intelligent, informed comments made by the vast majority of the participant here. Sometimes I get the best laugh of the day, other times I learn something new.
Cult members hard at work.
http://wattsupwiththat.files.wordpress.com/2014/02/micats-vigil-web.jpg
i would compare dana to a sack of sh*t,as he is full of it. however ,a sack of shit can be put to good use , there is no good use for the dana,s of this world. another liberal f*ckwit that likes to throw the denier word around.
it is easy to see this debate involves only academics at this point,most of whom have never experienced a good hard smack in the teeth .the sooner the debate enters the mainstream the better,then all these pasty faced nasal toned arseholes can learn a few lessons of the real world (the world where labeling someone a denier for holding a difference of opinion would be taken as a personal insult) inhabited by the ordinary people, that feel the bite of policies driven by idiots and liars every winter in the northern hemisphere.
Nuttercelli is typical of the post-modern scientist, who needs to do no research to come to his conclusions. He simply draws a graph that shows what he wants and presents it to the public as an easily digested cartoon of reality.
Amusingly, Nutty’s day job is an apologist for Big Oil…
You couldn’t make it up.
You are forgetting that Big Oil aka Shell, BP and Enron were the ones behind the CAGW scam in the first place.
SEE: Enron and BP invented the global warming industry
and my comment on Shell
They knew from the outset that CAGW would crash and burn and an entire new energy infrastructure would have to be build at citizens expense.
This is profiting off The Broken Window Fallacy writ large. Think of the glazier paying a bunch of teenage thugs to go around the area breaking windows taken to extremes.
We can now see why The Broken Window Allegory is not better known. The govenment/corporate complex uses it to move wealth from the pockets of the serfs into the pockets of the elite. Why else are regs regularly rewritten in such a way that farmers, restaurants and other businesses must routinely gut their buildings and rebuild when there was no health or safe issues?