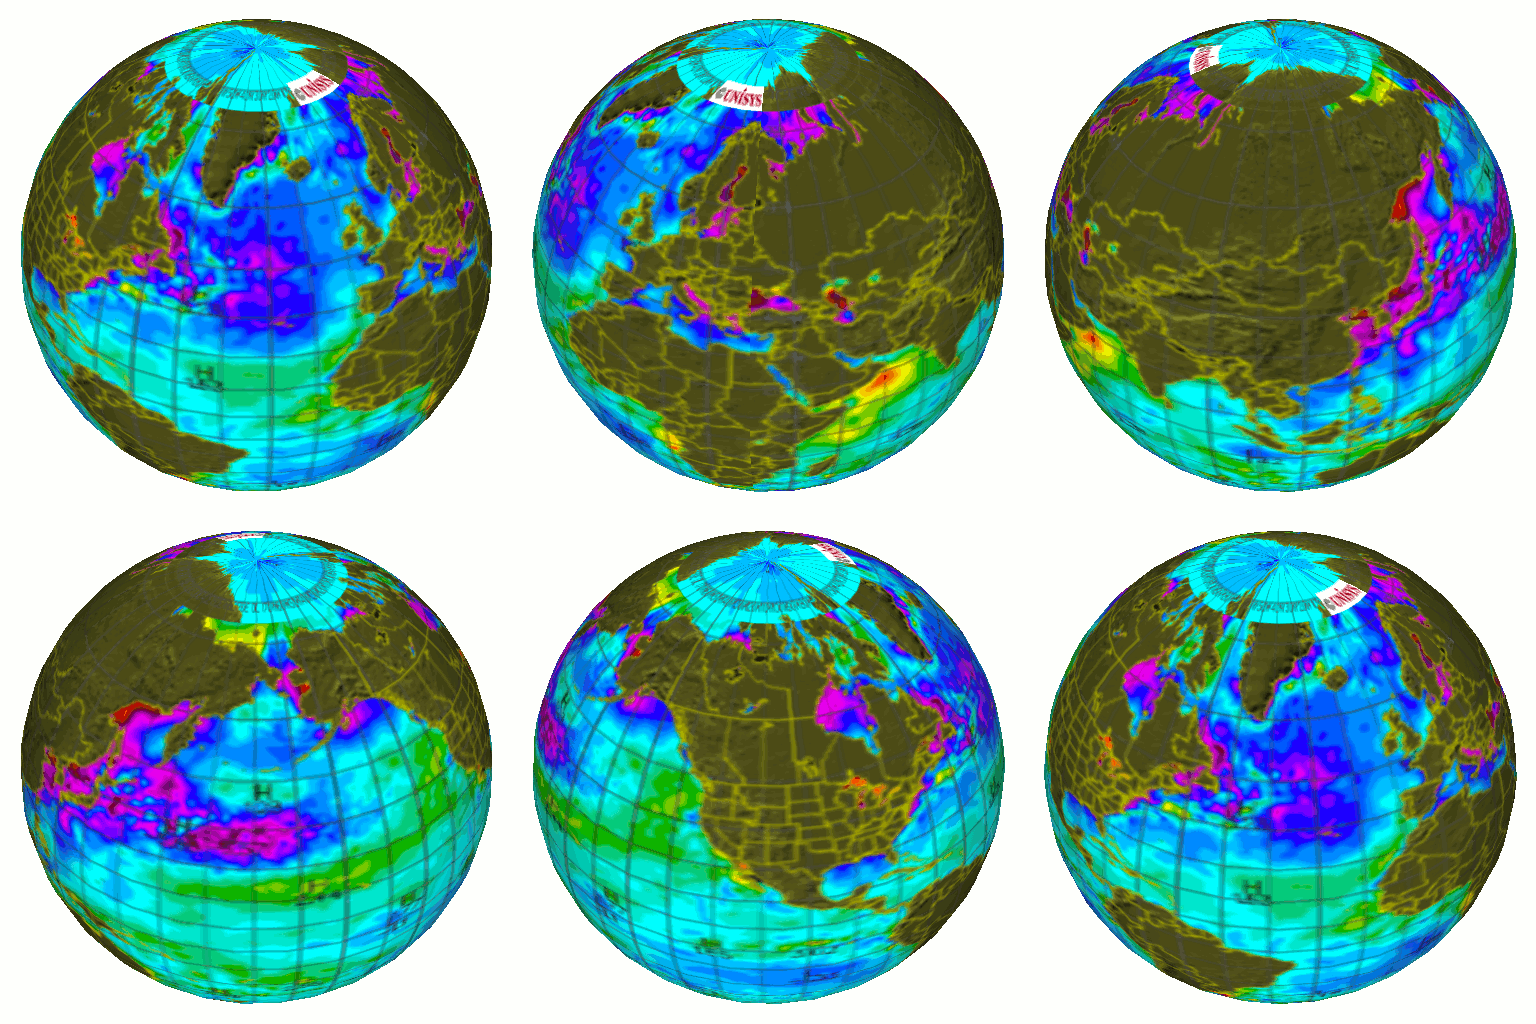
Experts announced this week that the missing heat has gone missing at the bottom of the sea, and it also appears the claimed record sea surface temperatures have gone missing too.
Disrupting the Borg is expensive and time consuming!
Google Search
-
Recent Posts
- Gaslighting 1924
- “Why Do You Resist?”
- Climate Attribution Model
- Fact Checking NASA
- Fact Checking Grok
- Fact Checking The New York Times
- New Visitech Features
- Ice-Free Arctic By 2014
- Debt-Free US Treasury Forecast
- Analyzing Big City Crime (Part 2)
- Analyzing Big City Crime
- UK Migration Caused By Global Warming
- Climate Attribution In Greece
- “Brown: ’50 days to save world'”
- The Catastrophic Influence of Bovine Methane Emissions on Extraterrestrial Climate Patterns
- Posting On X
- Seventeen Years Of Fun
- The Importance Of Good Tools
- Temperature Shifts At Blue Hill, MA
- CO2²
- Time Of Observation Bias
- Climate Scamming For Profit
- Climate Scamming For Profit
- Back To The Future
- “records going back to 1961”
Recent Comments
- Bob G on Gaslighting 1924
- Bob G on Gaslighting 1924
- conrad ziefle on Gaslighting 1924
- Bob G on Gaslighting 1924
- Bob G on Gaslighting 1924
- arn on Gaslighting 1924
- conrad ziefle on Gaslighting 1924
- Gordon Vigurs on Gaslighting 1924
- conrad ziefle on Gaslighting 1924
- Robertvd on Gaslighting 1924


Steven/Tony…
The -3 0 3 scale is probably the anomaly spread, but is this in °C or °F? I’ve looked through the linked Unisys site but I’m unable to find information about this graphic.
In all likelihood it’s in Celsius since the top of the linked graphic says “Sea Surface Temperature anomaly [dC]”.
Thank-you, my error (again).
Why is Lake Superior shown with a strong positive anomaly where last winter was so relentlessly cold, the surface entirely frozen over and ice persisted well into the spring? And followed by a summer with little need for air conditioning?
And it is 1-3 C colder than normal…
The data is from NOAA
Well, if it is ‘missing heat’, it only seems logical that they cannot find it.
All of the missing heat is in Lake Superior, in concentrated form which registers cooler.
Ah, but they’ve been claiming to have periodically found it in different locations! (Does the word “blowtorch” sound familiar?) Especially when we point out the abject failure of all their predictions. They have also claimed to have “found” it in the deep ocean, even though they haven’t been able to measure it there.
They are obviously delusional, and Tony’s series on the Missing Heat can help expose their delusion to newcomers.
RTF
Well, perhaps “unmask” is the better word for what he is doing with their delusion.
RTF
The missing heat is obviously hiding in the deep ocean underneath the still hidden but lurking 20′ sea level rise. That is a lot of sea level rise and has the potential to mask a lot of heat.
Looks like they’re past denying that the heat is “missing”. They’ve definitively been angry. Looks like they’re now in the bargaining stage. They’re trying to find alternatives that will still save face. They’re trying to regain control.
Can we expect depression and acceptance in the near future? It’s the slowest 5 stages of grief of loss of a “hypothesis” I’ve ever seen. Hypothesis is in quotes because it was found false before it was even conceived.
The missing heat has been sequestered to outer space.
If that were true the climatologists would be listening to Lindzen & Willie Soon’s ERBE studies.
Ive also been intrigued by the Unisys sea temperature chart recently which has shown more blue (cold) on it than at any time since Ive been checking it (about the last 5 years)
What is that huge mass of land where the Arctic Ocean is supposed to be?
Is there more decline-hiding going on?
Tthe missing heat is hiding out on the sun. http://solarscience.msfc.nasa.gov/images/Cycle22Cycle23Cycle24big.gif
“We are currently over five years into Cycle 24. The current predicted and observed size makes this the smallest sunspot cycle since Cycle 14 which had a maximum of 64.2 in February of 1906. “