Disrupting the Borg is expensive and time consuming!
Google Search
-
Recent Posts
- Gaslighting 1924
- “Why Do You Resist?”
- Climate Attribution Model
- Fact Checking NASA
- Fact Checking Grok
- Fact Checking The New York Times
- New Visitech Features
- Ice-Free Arctic By 2014
- Debt-Free US Treasury Forecast
- Analyzing Big City Crime (Part 2)
- Analyzing Big City Crime
- UK Migration Caused By Global Warming
- Climate Attribution In Greece
- “Brown: ’50 days to save world'”
- The Catastrophic Influence of Bovine Methane Emissions on Extraterrestrial Climate Patterns
- Posting On X
- Seventeen Years Of Fun
- The Importance Of Good Tools
- Temperature Shifts At Blue Hill, MA
- CO2²
- Time Of Observation Bias
- Climate Scamming For Profit
- Climate Scamming For Profit
- Back To The Future
- “records going back to 1961”
Recent Comments
- Bob G on Gaslighting 1924
- Bob G on Gaslighting 1924
- conrad ziefle on Gaslighting 1924
- Bob G on Gaslighting 1924
- Bob G on Gaslighting 1924
- arn on Gaslighting 1924
- conrad ziefle on Gaslighting 1924
- Gordon Vigurs on Gaslighting 1924
- conrad ziefle on Gaslighting 1924
- Robertvd on Gaslighting 1924
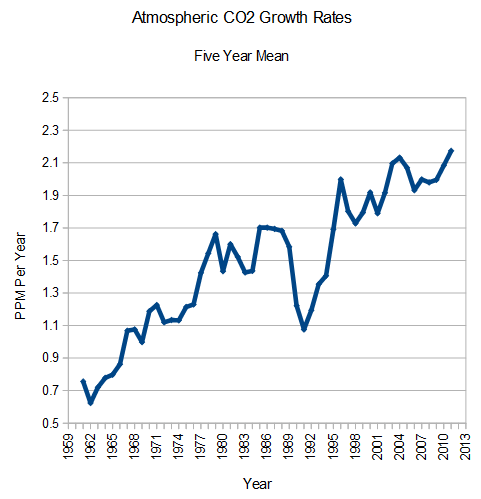
Growth Rates Of Atmospheric CO2 Has Increased To Record Levels Under Obama
This entry was posted in Uncategorized. Bookmark the permalink.


What happened in 1991?
Eruption of Mt. Pinatubo blocked sunlight and cooled the oceans.
Reblogged this on The Grey Enigma.
Proof that BS emits CO2. And here we always thought it was methane…
Steve you’re blaming the wrong President… again. It was obviously Clinton!
Reblogged this on Centinel2012 and commented:
A while back I need an equation to forecast CO2 and after some work playing with equations I found that the equation listed next will predict the level of CO2 as reported by NOAA each month within a few points ppm ignoring the seasonal variation.
CO2 =270+730/(1+8.75*EXP(0.00175*(4612-M)))
270 is a reasonable guess for the starting value of CO2 in the base year which is 1650 and M represents the number of months from January 1650 to the date a value is need, such that July 2014 would be 4975. Substituting 4975 for M will give a CO2 value of 399.53 the actual NOAA value was 399.0
A plot made from this equation will closely match NOAA number from 1958 to the present.