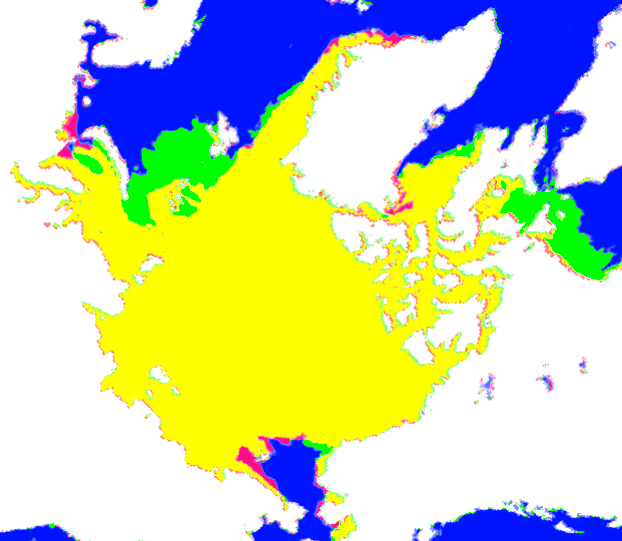
Green shows current ice which didn’t exist on November 25, 2006
Disrupting the Borg is expensive and time consuming!
Google Search
-
Recent Posts
- Gaslighting 1924
- “Why Do You Resist?”
- Climate Attribution Model
- Fact Checking NASA
- Fact Checking Grok
- Fact Checking The New York Times
- New Visitech Features
- Ice-Free Arctic By 2014
- Debt-Free US Treasury Forecast
- Analyzing Big City Crime (Part 2)
- Analyzing Big City Crime
- UK Migration Caused By Global Warming
- Climate Attribution In Greece
- “Brown: ’50 days to save world'”
- The Catastrophic Influence of Bovine Methane Emissions on Extraterrestrial Climate Patterns
- Posting On X
- Seventeen Years Of Fun
- The Importance Of Good Tools
- Temperature Shifts At Blue Hill, MA
- CO2²
- Time Of Observation Bias
- Climate Scamming For Profit
- Climate Scamming For Profit
- Back To The Future
- “records going back to 1961”
Recent Comments
- Bob G on Gaslighting 1924
- Bob G on Gaslighting 1924
- conrad ziefle on Gaslighting 1924
- Bob G on Gaslighting 1924
- Bob G on Gaslighting 1924
- arn on Gaslighting 1924
- conrad ziefle on Gaslighting 1924
- Gordon Vigurs on Gaslighting 1924
- conrad ziefle on Gaslighting 1924
- Robertvd on Gaslighting 1924


An observation…it looks to me like a new climate “pause” is emerging – this time in the NH sea ice. Since about 2006, there appears to no downward trend. I wonder if there will in fact be a major recovery over the next decade towards 1980s sea ice levels.
http://arctic.atmos.uiuc.edu/cryosphere/IMAGES/seaice.anomaly.arctic.png
Frank / others …. look at the change in the nature of the data between 3 periods: up to 1997 it is flat with medium amplitude variation year to year and then the decline starts but look at the amplitude tighten up and then starting in 2007 we see wild amplitude swings. I wonder how much of this is real natural and how much is down to the data processing / manipulation / fudging.
We know the alarmists are liars and data torturers and this has always bothered me!
If the sun keeps dragging us down the current climate path, it could recover way beyond that. But then, we don’t know what it was like during ice age time.
we have such a short period of time really that this is probably just a cycle…i mean if we had satellites up since 1900, we might have a better idea…however, if we could get big Al to park his ass up there at the Pole for a couple of years, we would be above average in a heart beat!
“we have such a short period of time really that this is probably just a cycle…”
This is true of ALL short term weather observations that, thanks to our unhinged warmist friends, somehow become harbingers of climate (when the data are convenient).
Of course, as this blog has amply shown, there is certainly a LOT of anecdotal evidence from old newspaper and magazine reports that the arctic has been warmer than today.
Actually the Danes have records going back to the 1890’s. The Hudson Bay fur trading company goes back to the 1700’s. It just takes a little work to dig up the history, but a number of people have done it. “Tony B” from “Air Vent” did some work and posted the following on WUWT back in 2009:
http://wattsupwiththat.com/2009/06/20/historic-variation-in-arctic-ice/
Even if you don’t like reading history books or papers, all you need to do is watch the yearly growth and shrinkage of sea-ice, and you soon realize that much of what is preached as “science” is poppycock. I gritted my teeth through a recent example of such poppycock on “The Weather Network”, and was left wondering how on earth people can utter such bilge without any apparent awareness they are talking nonsense.
I briefly discuss a particularly exasperating paragraph of the bilge at:
http://sunriseswansong.wordpress.com/2014/11/29/arctic-sea-ice-recovery-neglected-ice/
The simple fact of the matter is that there has been less ice than we currently see, and more ice than we currently see, over and over and over again in the past. It is a normal cycle, not a death spiral.
I check the Arctic ice picture from NSIDC every morning. It seems to me that currently ice growth is lagging the anomaly line by only a matter of days over most of the area and has expanded beyond the anomaly line along a significant portion of the ice boundary.
It’s interesting to me that a lot of the water between Alaska and Siberia is below the anomaly temp. I’ve watched that temp drop over the last week using the nullschool.net model, so that will freeze up real nice soon. it really could catch up to the anomaly line in the next month.
On that cold note, Happy Thanksgiving to everybody on this blog.
It would seem these minor excursions during an inter-glacial period are quite normal.
http://arctic.atmos.uiuc.edu/cryosphere/IMAGES/global.daily.ice.area.withtrend.jpg
Reblogged this on Centinel2012 and commented:
Most ice is caused by increased global warming!
You will find this interesting Tony
http://en.mercopress.com/2014/11/27/antarctica-sea-ice-thicker-than-anticipated-reveals-an-autonomous-sub
Andy