Disrupting the Borg is expensive and time consuming!
Google Search
-
Recent Posts
- Ice-Free Arctic By 2014
- Debt-Free US Treasury Forecast
- Analyzing Big City Crime (Part 2)
- Analyzing Big City Crime
- UK Migration Caused By Global Warming
- Climate Attribution In Greece
- “Brown: ’50 days to save world'”
- The Catastrophic Influence of Bovine Methane Emissions on Extraterrestrial Climate Patterns
- Posting On X
- Seventeen Years Of Fun
- The Importance Of Good Tools
- Temperature Shifts At Blue Hill, MA
- CO2²
- Time Of Observation Bias
- Climate Scamming For Profit
- Climate Scamming For Profit
- Back To The Future
- “records going back to 1961”
- Analyzing Rainfall At Asheville
- Historical Weather Analysis With Visitech
- “American Summers Are Starting to Feel Like Winter”
- Joker And Midnight Toker
- Cheering Crowds
- Understanding Flood Mechanisms
- Extreme Weather
Recent Comments
- Bob G on Ice-Free Arctic By 2014
- Bob G on Ice-Free Arctic By 2014
- conrad ziefle on Ice-Free Arctic By 2014
- conrad ziefle on Ice-Free Arctic By 2014
- Disillusioned on Ice-Free Arctic By 2014
- conrad ziefle on Debt-Free US Treasury Forecast
- Nicholas McGinley on Debt-Free US Treasury Forecast
- Nicholas McGinley on Debt-Free US Treasury Forecast
- Bob G on Ice-Free Arctic By 2014
- stewartpid on Ice-Free Arctic By 2014
GISS Reminds Us That Cold Is The New Hot
This entry was posted in Uncategorized. Bookmark the permalink.


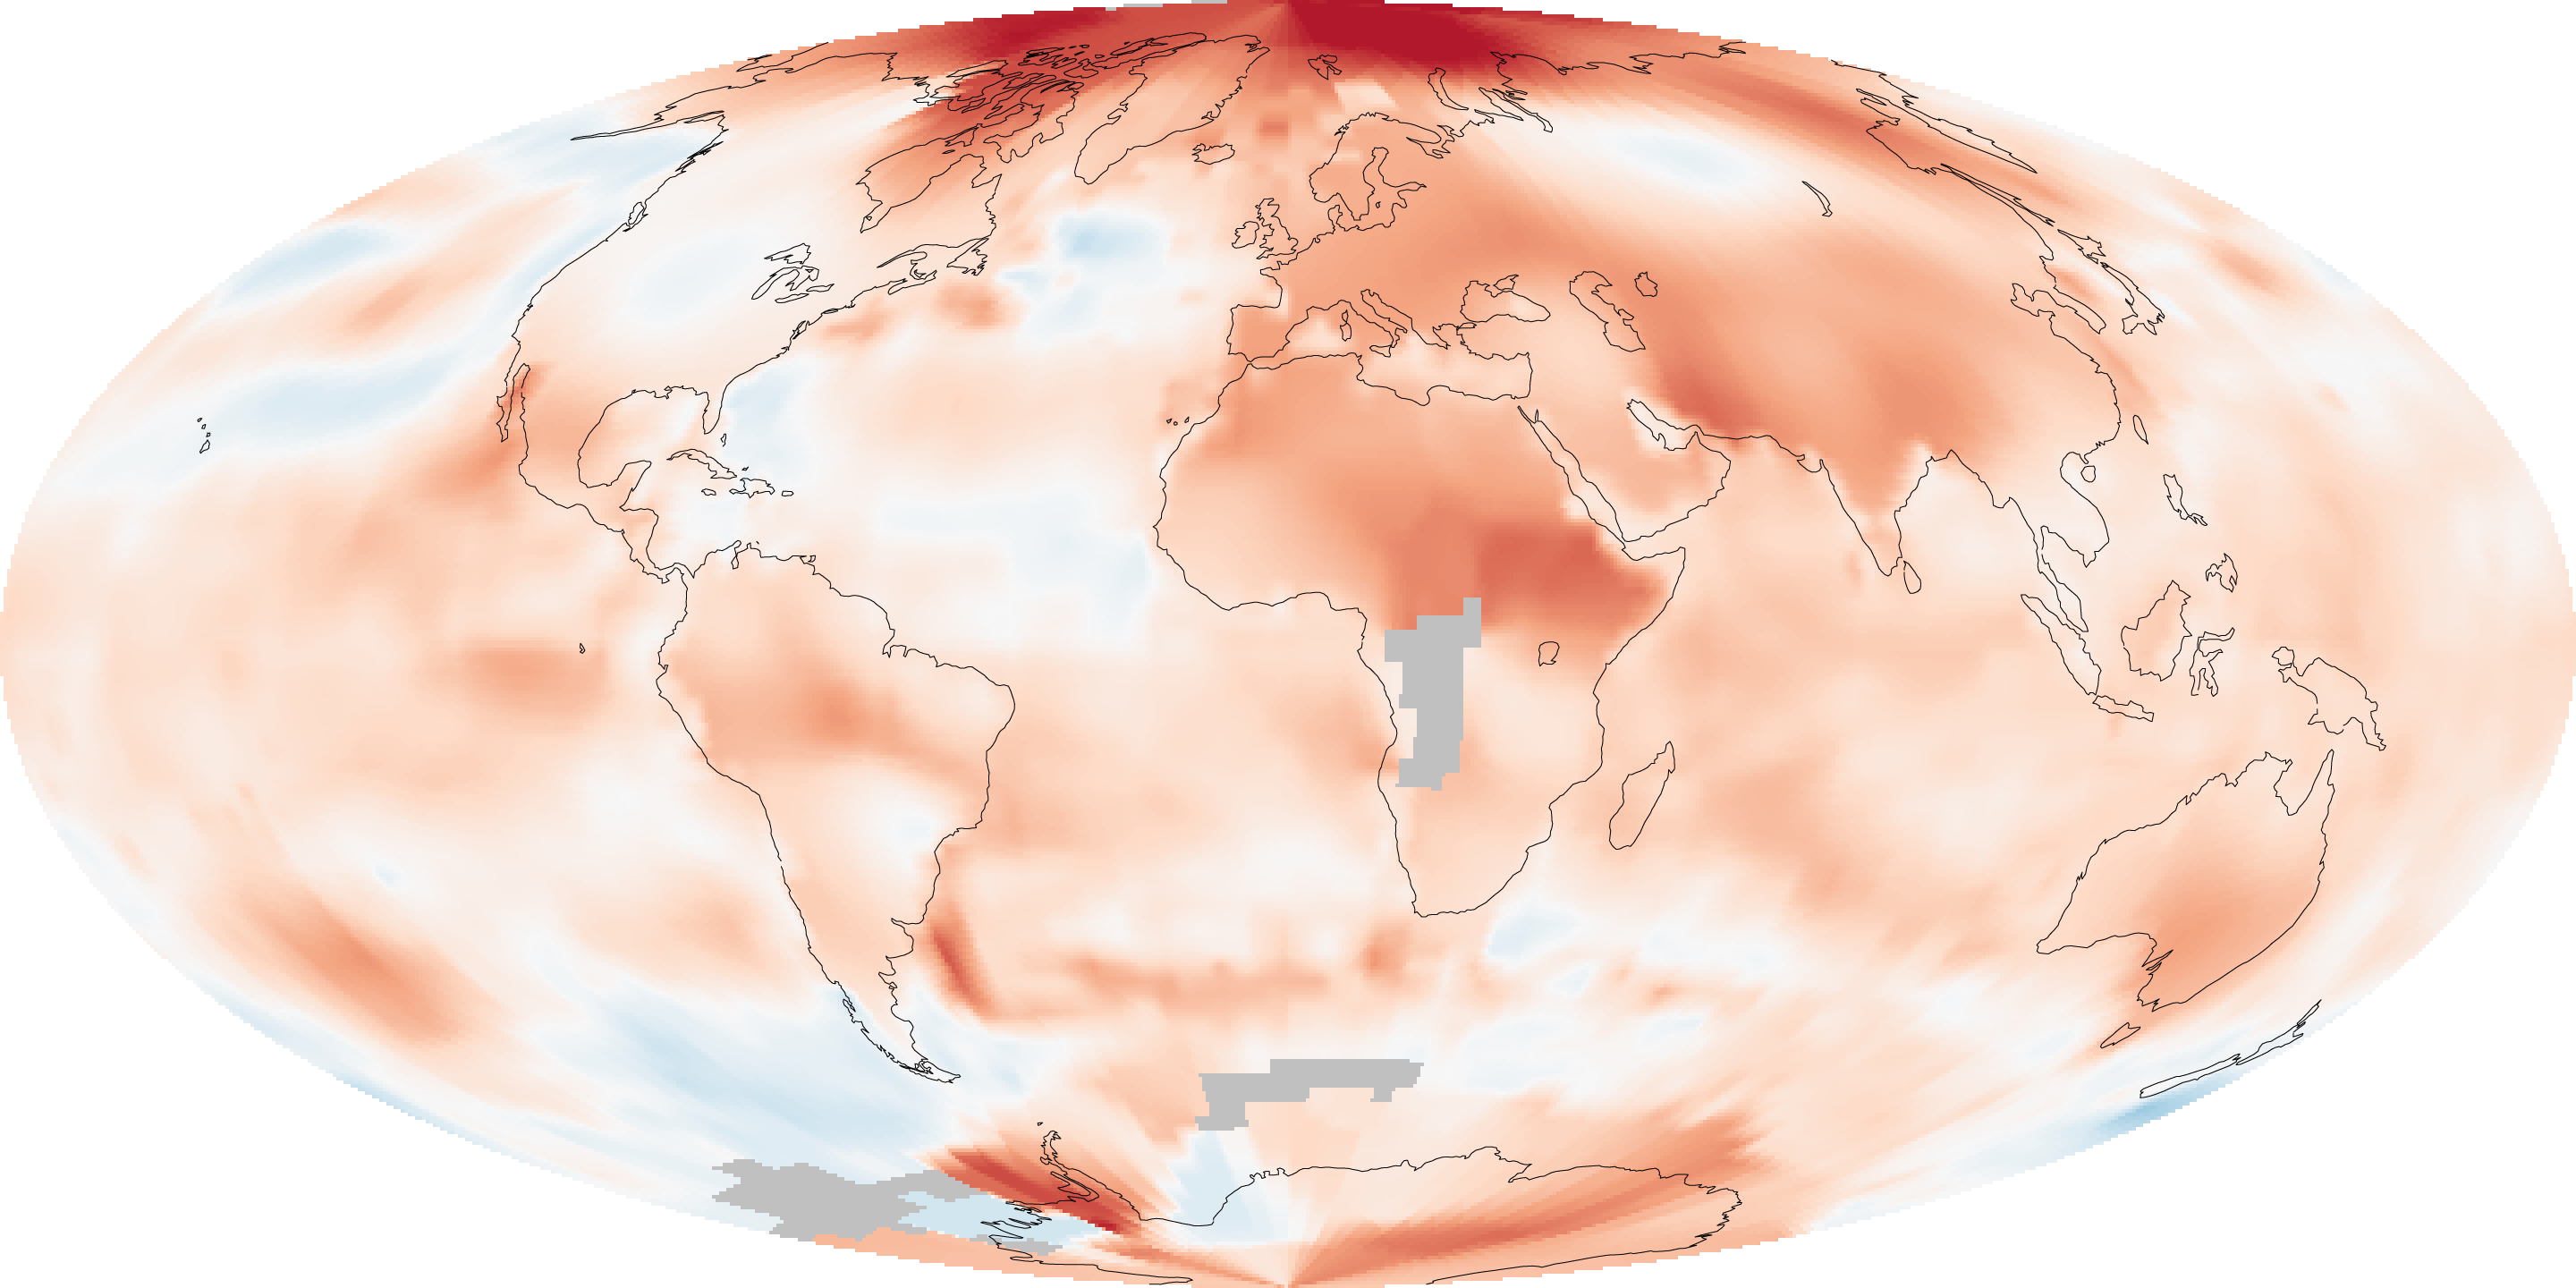
I was looking at this the other day. What’s funny about this is that this is a plot of surface temps on a NASA website that is all about satellite imagery.
NASA GISS must be the only NASA agency still measuring on the ground. Maybe they’ll get with the space age someday.
and there baseline….time to bring it back inline with the last 30 “normal” years…nah….why let good BS get in the way of a HOT graph
Its much more difficult to apply algorerhythmic fudgetery to data collected from sat. So fer now, we keep it on the ground.
I really pains me to see what this insanity has done to an institution such as NASA.
They can make it appear warm anywhere they like since they omit a very large number of ground based measurement sites and extrapolate 1200 km across regions where they have no data.
Thanks Steve and Anthony
http://wattsupwiththat.com/2010/05/20/giss-arctic-trends-disagree-with-satellite-data/
The map description comes as 2009.
Is this a summary of 2009 overall estimated anomaly or what?
The link in full is this:
http://earthobservatory.nasa.gov/images/imagerecords/42000/42392/GISS_temperature_2009_lrg.png
Etudiant:
It does not matter what it is labeled. It is from GISS and it is Garbage!
Now they are saying (after the fact) that the warm Arctic is making it unusually cold in mid-latitudes where most people live. Make up your freaking mind!!!
It doesn’t matter whether this winter is particularly cold or not, what’s important is the long-term trends, and the long term trends clearly show that the earth is warming.
Also, as far as I can tell, the only issue with GISS and the extrapolation of data over 1200km is in the arctic, where temperature data is sparse. If you ignore the arctic region on this map, you still see a lot more red than blue.
Yes, it is really hot out there.
Katie:
Truly long term trends show a cooling climate. However if you are looking at the recovery from the LIA then you are partly correct. The best reference to any warming is from the PROPERLY adjusted data. The raw data shows no warming for the last 60 years or longer.
This winter being especially cold goes against the AGW theory and if you remove all questionable records you will have nothing to base any results on because more than 90% of the globe is not well represented in the historic climate records.
The only thing wrong with GISS is the fact that it even exists!
Katie
The satellites show only a very small temp increase since 1979 and since about 1995 no increase at all. There is considerable evidence that global temps in the 1930’s were at a similar level to today.
And of course as Mike says, we would expect a moderate amount of warming coming out of the LIA.
“This winter being especially cold goes against the AGW theory”
Mike, like I said, one year doesn’t prove anything either way. Anyways, if we actually look at temperatures around the globe, not just North America and Europe, this year is not particularly cold. The temperatures in North America and Europe are being influenced by the North Atlantic oscillation, which is currently in a negative phase.
“The satellites show only a very small temp increase since 1979 and since about 1995 no increase at all.”
Paul, I consider a 0.4 degree increase in 30 years more than a small temperature increase. And when you say that we would expect warming coming out of the LIA, if this is referring to an increase in the sun’s activity (which is thought to have caused the end of the LIA), the sun’s activity has been about level for the past 30 years, so this warming must be due to some other cause.
From 1910 to 1940, temperatures also rose 0.4 degrees. Was that due to SUVs?
So like the 11 year solar cycles are a figment of our imagination and we don’t have variable solar storms ?
Katie
The temperature patterns we see make sense when you look at PDO cycles.