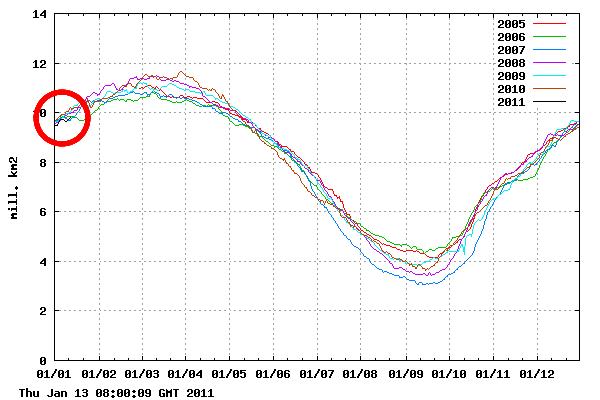
You can see why some “scientists” at NASA and NOAA want to re-engineer the world’s economy over a possibly missing ice cube.
Disrupting the Borg is expensive and time consuming!
Google Search
-
Recent Posts
- Gaslighting 1924
- “Why Do You Resist?”
- Climate Attribution Model
- Fact Checking NASA
- Fact Checking Grok
- Fact Checking The New York Times
- New Visitech Features
- Ice-Free Arctic By 2014
- Debt-Free US Treasury Forecast
- Analyzing Big City Crime (Part 2)
- Analyzing Big City Crime
- UK Migration Caused By Global Warming
- Climate Attribution In Greece
- “Brown: ’50 days to save world'”
- The Catastrophic Influence of Bovine Methane Emissions on Extraterrestrial Climate Patterns
- Posting On X
- Seventeen Years Of Fun
- The Importance Of Good Tools
- Temperature Shifts At Blue Hill, MA
- CO2²
- Time Of Observation Bias
- Climate Scamming For Profit
- Climate Scamming For Profit
- Back To The Future
- “records going back to 1961”
Recent Comments
- Bob G on Gaslighting 1924
- Bob G on Gaslighting 1924
- arn on Gaslighting 1924
- conrad ziefle on Gaslighting 1924
- Gordon Vigurs on Gaslighting 1924
- conrad ziefle on Gaslighting 1924
- Robertvd on Gaslighting 1924
- conrad ziefle on Gaslighting 1924
- arn on Gaslighting 1924
- Gordon Vigurs on Gaslighting 1924


In the context of lots of Australian Flood stories…
“We’re rooned said Hanrahan”
Steve you forgot to post this graph.
http://nsidc.org/data/seaice_index/images/daily_images/N_stddev_timeseries.png
Are you insinuating that is a shockling low level? Heh
Yes, you can see how much extent has changed in the DMI graph, being right where it always is.
http://stevengoddard.wordpress.com/2011/01/13/arctic-ice-recovering-in-three-dimensions/
I just posted a graph that includes more information and is at a different scale from Steve’s. Since most people here think I am usually insinuating, you are free to do so.
Ever look at those 10,000X electron microscope pictures of scary little mites?
Steve,
I don’t see an average of around 1-2 million KM2 less than the ’79-2000 average as being microscopic. It looks like this years is dancing with the lowest ice extent on record.
OMG – the missing ice in Baffin Bay is going to totally affect the summer minimum.
Not.
Hey Tony, have you ever figured out the differential in the ice extents reported by the various organizations reporting that same number ?
Why is there such a large difference if they are all supposedly measuring the same thing ?
Tony Duncan says:
January 13, 2011 at 6:45 pm
I don’t see an average of around 1-2 million KM2 less than the ’79-2000 average as being microscopic.
Do you see it as being normal? Do you see it as more than there was 1000 years ago? 2000 years ago? 3000?
Do you know? It’s doubtful that you do. You think you’re being clever though.
Amino,
I don’t know, I have never given any pretense of being an expert in any of these fields, and of course you think I am being clever when I just post a perspective that gives more information than Steve’s post
Tony,
In regard to your “I don’t see an average of around 1-2 million KM2 less than the ’79-2000 average as being microscopic.”
According to NSIDC’s most recent Sea Ice News…
“Arctic sea ice extent averaged over December 2010 was 12.00 million square kilometers (4.63 million square miles). This is the lowest December ice extent recorded in satellite observations from 1979 to 2010, 270,000 square kilometers (104,000 square miles) below the previous record low of 12.27 million square kilometers (4.74 million square miles) set in 2006 and 1.35 million square kilometers (521,000 square miles) below the 1979 to 2000 average.”
Sounds scary doesn’t it?
Let’s look again…
Dec ice extent = 12 Mkm^2
1979-2000 avg = 13.35 Mkm^2 (12Mkm^2 + 1.35 Mkm^2 difference)
This equates to a 10.11% difference
This is a football field”
Let’s just say those little blue rectangles are puddles of water. Would call this field alarmingly wet? Of course not.
This is the equivalent, as a percentage of area, of the “unprecedented” melting. While it might not be microscopic, it’s by no means significant either.
Seems we might be back to that perspective thing we last talked about.
I tried to put the image inline and it didn’t work out…
Click here for the football field image.
Robb,
I think it is quite possible for a 10% difference to be significant. Whether it is or not I can’t say. I can certainly say it is not microscopic. Steve and others have been saying there is a rebound in arctic ice and climate scientists are saying that it is not recovering. The next few years should see if there is a significant increase in arctic ice and bear out Steve’s view.
I figured you’d say that. So the next question I must ask is a 10% difference from what? 10% lower thank normal? 10% lower than recorded highs? As always perspective is the key.
The below link is to a chart of Arctic conditions spanning the terrestrial & satellite time frames. Do you notice anything? (I tried to make it obvious.)
Arctic Conditions 1900-2000
Ever think you’re only seeing half the picture?
reference: Polyakov, I.V., V.A. Alexeev, G.I. Belchansky, I. Dmitrenko, V.V. Ivanov, S. Kirillov, A. Korablev, M. Steele, L. Timokhov, I. Yashayev (2008), Arctic Ocean freshwater changes over the past 100 years and their causes, Journal of Climate, 21(2), 364-384.
Yes it’s boiling hot in the Arctic this time of the year 🙂
It’s very telling to look at the shot of the entire arctic with trend lines…. then it becomes obvious the tiny difference between now and the average. We’ve got snow in 49 states. How does that compare to the average?
Pingback: Oh My! 2010 tied for ‘hottest’ year?! Relax, it is ‘purely a political statement’ | NW0.eu