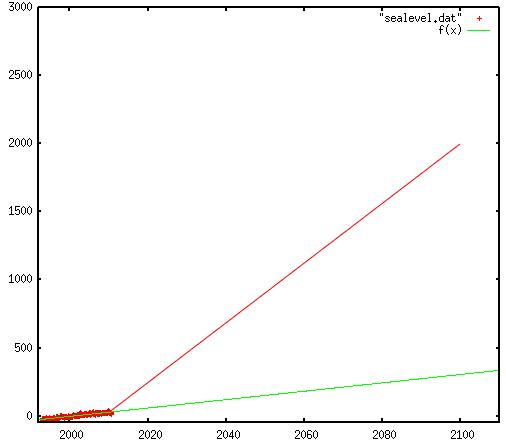
Satellite data shows that sea level rise rates have slowed in the last five years.
http://sealevel.colorado.edu/current/sl_noib_global.txt
Green line below shows the projection out to 2100 – 30 cm. The purple line below shows Hansen’s two metre forecast.


Let’s face it.
The USA on the level of the Obama Administration and it’s institutions has become a
‘Red State’ selling ‘Red Propaganda’.
McCarthy was correct.
Your Hansen graph is in error 😉 The pink line should only zoom off up to 2m after a suitable decadal lull. By drawing it from 2011 you give a false impression that people will be able to measure meteoric sea level rises while Hansen is still employed. Climate doesn’t work like that. All the tipping points are now scheduled for some time after 2040ish.
A new glacial isostatic adjustment model based on gps data now clearly shows that the sub ice rock below central Greenland is sinking. Estimates of ice reduction have been reduced by more than 50%. This has turned ice loss estimates upside down and even resulted in now renaming isostatic rebound as isostatic adjustment. http://thegwpf.org/the-observatory/1438-ice-sheet-loss-cut-in-half.html
However watch articles continue to use the old estimates and ignore the new ones.
Let me be the first to say:” OMG, it’s worse than we thought!”
It is worth pointing out the changes in ice mass in Greenland are 1 part in 10,000. Any experiment which measured to this degree of accuracy would be considered exceptional.
So much more likely the errors in the Ice Mass measurement are far greater than any changes noted.
As they have no satellite data to compare it to from before they cannot say whether the rate is increasing or not.
An exercise in vagueness:
“..much sooner than model forecasts have predicted”
“It’s losing mass – much more than was expected many years ago.”
Which models? How many years ago? By whom?
“..raise global sea levels by an average of 1.3mm a year”
Wow.. 1.3mm a year? That’s like 13cm per century! Catastrophic! And the kicker:
“The study showed that in 2006..”
So the study is 5 years out of date, or they’re choosing not to say how things are now. Typical alarmist BS.
Much to do about a couple silly millimeters! Wasn’t there a cigarette commercial that talked about a “couple silly millimeters”?
I heard the Glacier Gal WWII bomber was covered by +/- 250′ of Ice in 60 years..
How can this happen if the Greenland Glaciers are melting rapidly?
Bill Price