[youtube=http://www.youtube.com/watch?v=Bry4ztiqSjY]
The summer melt season is over, and the Arctic is now gaining ice at a rate of 60,000 km² per day.
In more technical terms, that is 1,000 Manhattans per day, or 250 Petermann Glacier Ice Islands per day. You could also think of it as one new Manhattan of ice forming every minute and a half, or one new Petermann Ice Island every six minutes.
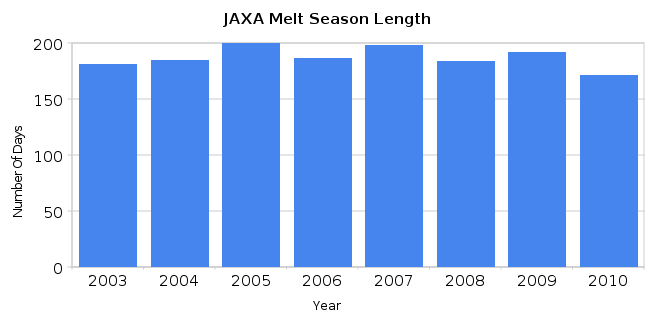
Mark Serreze at NSIDC wrote in 2008 : “As the climate warms, the summer melt season lengthens …”
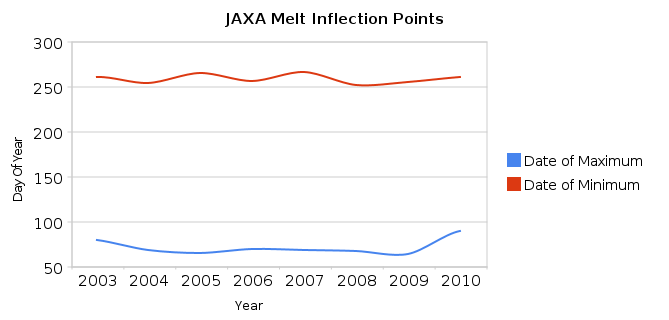
In 2010, the Arctic sea ice extent maximum occurred on March 31, and the minimum occurred on September 18. That makes the 2010 melt season the shortest in the JAXA record, at 171 days.
The graph below shows the start and end dates of the maximums and minimums since 2003. There is no trend seen in either.


…one new Petermann Ice Island every six minutes.
I think when making statements like the above, obviously intended to give perspective to an issue, it would be worth considering volume as well as area. Otherwise, one just muddies the waters….
tell me how volume can be decreasing?
it is you that is truly muddying the waters.
but maybe you have an explanation that would make sense on some other planet as to how volume could be decreasing….. oh, wait, i know what you’ll say “a computer model shows volume decreasing”.
And where did I say “volume is decreasing”?
What I did say is that “volume should be considered” when using an example like this to add perspective. I seriously doubt that the Arctic is currently adding a volume of ice that is anywhere near “250 Peterman Glacier Ice Islands per day.”
Steve says he’s just using the same metric, but the initial metric was to describe the size of a glacier with the implication that it had significant thickness and with no attempt to describe that thickness. To then use that same “metric” to say that a re-freezing is equivalent to a certain number of “Peterman ice islands” risks conflating volume with extent. A thin skin of ice across the Arctic that is equivalent in surface area to that of 250 “Petermans” constitutes nowhere near the ice actually contained in 250 “Petermans” but a casual reader might infer that it does. That was my point in saying that it “muddies the waters.”
And that’s without even considering the possibility that the extent increase could be simply due to wind-driven dispersal without any re-freezing at all. (I know it’s re-freezing now, but a week or so ago it could have been entirely wind-driven and the same “metric” could have been applied, at which point it would have been even more misleading, or more “muddying.”)
Rod,
Have you considered that you are wrong?
Rod
“I know it’s re-freezing now”
So then why even make all this protest??
Thou dost protest too much.
Rod says:
September 27, 2010 at 3:47 am
And where did I say “volume is decreasing”?
Ok, so it’s staying the same?
The Petermann “ice island” was widely reported as being the area of “four Manhattans.” I’m just using the same metric. ;^)
Mark Serreze at NSIDC wrote in 2008 : “As the climate warms, the summer melt season lengthens …”
There’s the real world. Then there’s the world of Mark Surreze.
Hey Mark, take a look at the data.
1,000 Manhattans per day…
It’s hard to rationalize away this fast growth. But some are trying hard to.
Regarding Petermann Ice Island:
The Petermann Ice Island fractured into two pieces on September 9 after colliding with, and then scraping along, Joe Island at the mouth of the Petermann Fiord. The larger of the two pieces (PII-B) is 160 km2. The smaller of the two pieces (PII-A) is 80-85 km2(which is still 3 to 4 times the size of the 2008 Petermann Ice Island). PII-A has been moving rapidly southwards, down Nares Strait. On September 13, it was located at approximately 80ºN, near the northern entrance to Kane Basin, approximately halfway down the strait. The average drift rate of PII-A has been about 40 km/day (it travelled approximately 160km south between September 9 and September 13).
On September 17, they dropped a beacon on PII-A. You can follow it here:
http://sailwx.info/shiptrack/shipposition.phtml?call=47557
In German but easy to follow:
max, date of max, min, date of min, loss, days of melt, melt/day, gain, days of gain, gain/day
the first graphic is clear, I think, the second are gains/loss of extenet
Should be able to get all that here:
http://www.ijis.iarc.uaf.edu/seaice/extent/plot.csv
I recommend putting together your own spreadsheet from that file. The numbers are 15% extent and -9999 means no data for that day. Once you have your own spreadsheet, it’s easy to call the bluffs of other posters (both when the skeptics and non-skeptics do it).
-Scott
@Scott
exactly what I did
Eyeballing the bar graph at the top of this post, looks like the melt season is trending shorter and shorter. At the current rate we’ll be at a melt season of only 150 days by 2015. The melt season is in a death spiral!
Krishna Gans says:
September 27, 2010 at 5:00 pm
Sorry about the misunderstanding…I didn’t realize that link you made was to your own site.
Keep up the good work.
-Scott
Pingback: Global Warming Hoax Weekly Round-Up, Sep.30th 2010 « The Daily Bayonet