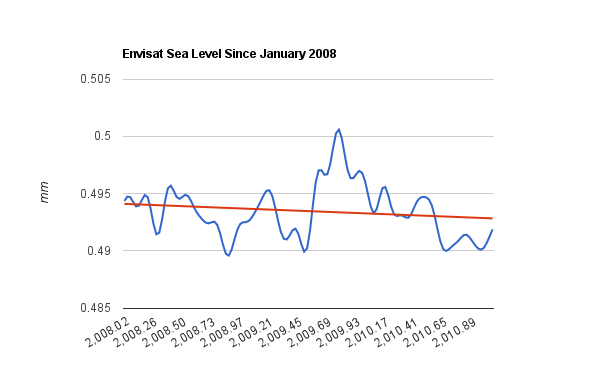
Launched in 2002, Envisat is the largest Earth Observation spacecraft ever built. It carries ten sophisticated optical and radar instruments to provide continuous observation and monitoring of the Earth’s land, atmosphere, oceans and ice caps. Envisat data collectively provide a wealth of information on the workings of the Earth system, including insights into factors contributing to climate change.
If you wanted to hide this, how would you do it?
http://www.aviso.oceanobs.com/
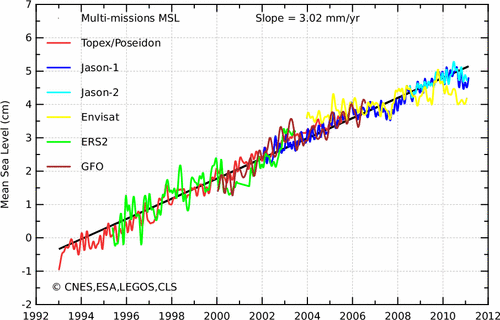
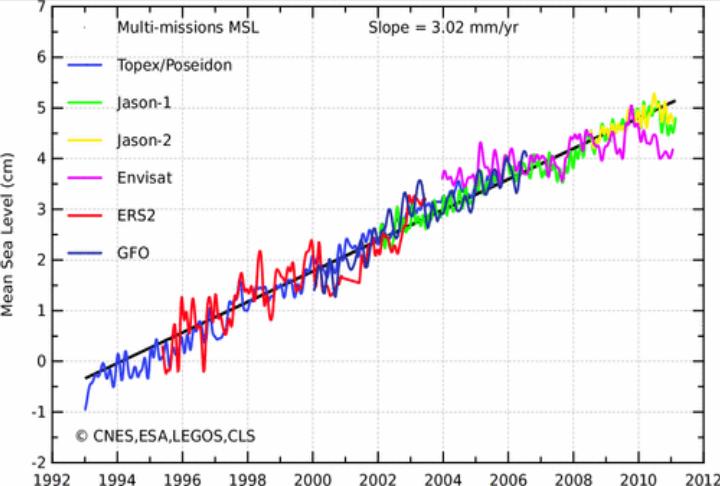
You might want to make it almost invisible yellow. Let’s shift the hues and see what happens.
Oops! It turns out sea level is hardly rising. Now, let’s remove all of the “adjustments” to Envisat data.
http://www.aviso.oceanobs.com/
We see a rise rate which is about one-fourth of what the global warming community claims.
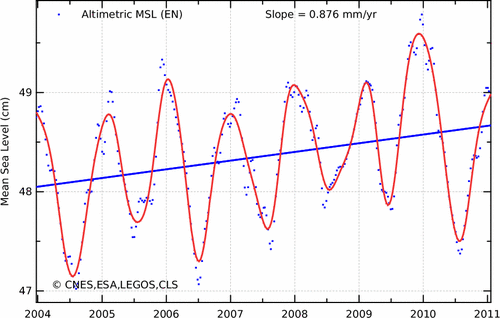
Even with all the adjustments, rates are about one-third of what the global warming community claims.
http://www.aviso.oceanobs.com/
1.2 mm/year is much lower than alarmist claims, but is about triple the mean of NOAA tide gauges.
http://tidesandcurrents.noaa.gov/sltrends/MSL_global_trendtable.html
So, we can see that sea level claims are exaggerated by somewhere between 3-9X, which seems to be in line with other bloated IPCC numbers.


You still have wait 21 years for 1 (one) lousy stinking climate science data point.
(If it works that long)
Sorry John:
With known variations in regional weather patterns you may have to wait 30 years just to determine the latest high or low and another 30 to find the opposite number. It is possible you might not observe an entire “Cycle” in short term weather patterns for 80 years or longer and then you have to take into consideration the even longer term weather patterns such as 1000, 40,000, or 120,000 and some in between!
Satellite records are helpful to understand weather but using them for climate is a fool’s game.
This is a three year trend. I wouldn’t say three years is trivial, even if there is a long term uptrend. Time will tell whether the short term trend will hold.
Supposedly we have had record melt in Greenland and Antarctica during the last few years. Did the water go down the rabbit hole?
Wascally sea wevel!
Well we do have record melt.
Also we have islands going underwater – so satellite data is relevant to the displaced island dwellers how?
Maybe the data has been corrected due to errors in the system? Cause the sea level is higher by measurements from the ground.
I have never seen so much irrelevant and pointless argument to turn the data into something it isn’t.
Which island do you think is going underwater?
Islands going underwater? But to find the data and/or news in Internet we would very much like to see a name for some island that is going underwater, or it’s coordinates so we can maybe find it in Google Earth or some such. Talking about some islands without giving a name for even one of them, now THAT truly is irrelevant and pointless.
Nice work Steven, as usual very informative, educational, clearly presented and on target dealing with the facts. It’s also nice they give out their raw data.
I noticed some problems with the Mean Sea Level graphs from the University of Colorado and made a blink comparison video of it here:
http://pathstoknowledge.net/2011/04/25/questions-about-the-historical-global-mean-sea-level-graphs-from-the-university-of-colorado/
Shall we see what the folks actually running Envisat say?
Radar allows scientists to measure the sizes of the ice caps, sea level and the land. For example, Greenland’s ice caps are melting twice as fast as scientists thought, and we know this because of Envisat. Melt water will raise the sea level, which we now know from Envisat data is rising at about 3 millimetres a year.
http://www.spacecentre.co.uk/spacenow/newsitem.aspx/2/840/Launch_Into_Space
Or what the scientists at U Colo who run a center measuring sea level say?
An analysis of the steric and ocean mass components of sea level shows that the sea level rise budget for the period January 2004 to December 2007 can be closed. Using corrected and
verified Jason-1 and Envisat altimetry observations of total sea level, upper ocean steric sea level from the Argo array, and ocean mass variations inferred from GRACE gravity mission observations, we find that the sum of steric sea level and the ocean mass component has a trend of 1.5 +/- 1.0 mm/a over the period, in agreement with the total sea level rise observed by either Jason-1 (2.4 +/- 1.1 mm/a) or Envisat (2.7 +/- 1.5 mm/a) within a 95% confidence interval.
http://sealevel.colorado.edu/content/closing-sea-level-rise-budget-altimetry-argo-and-grace
How about an update?
The Envisat-data over the last half year show mean sealevel-rise has dropped to about 0,8 mm/year.
http://www.aviso.oceanobs.com/fileadmin/images/news/indic/msl/MSL_Serie_EN_Global_IB_RWT_GIA_Adjust.gif