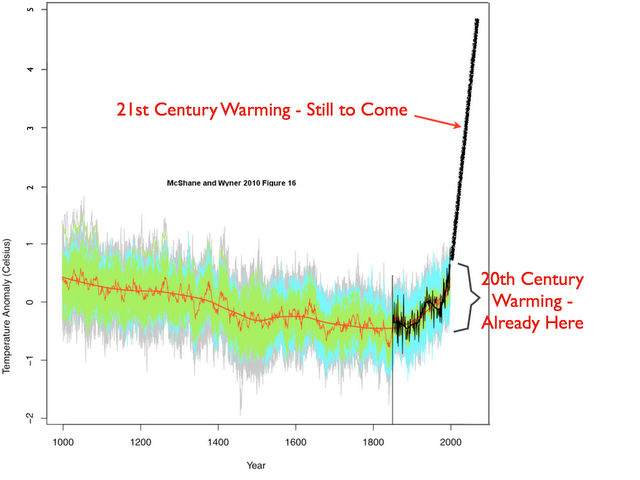
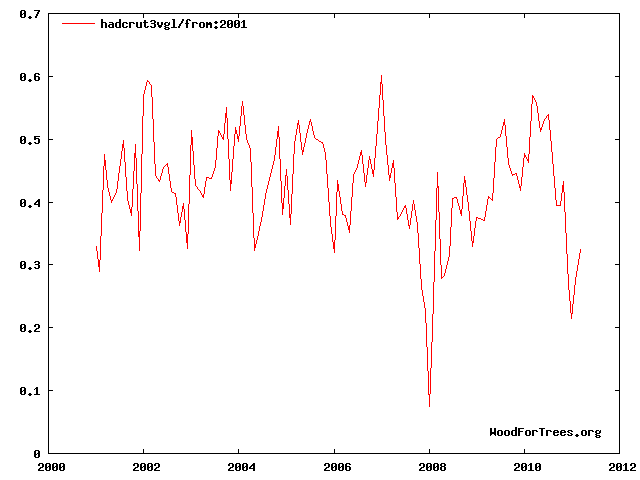
Temperatures may be going down this century, but that doesn’t mean they aren’t skyrocketing.
Disrupting the Borg is expensive and time consuming!
Google Search
-
Recent Posts
- “Why Do You Resist?”
- Climate Attribution Model
- Fact Checking NASA
- Fact Checking Grok
- Fact Checking The New York Times
- New Visitech Features
- Ice-Free Arctic By 2014
- Debt-Free US Treasury Forecast
- Analyzing Big City Crime (Part 2)
- Analyzing Big City Crime
- UK Migration Caused By Global Warming
- Climate Attribution In Greece
- “Brown: ’50 days to save world'”
- The Catastrophic Influence of Bovine Methane Emissions on Extraterrestrial Climate Patterns
- Posting On X
- Seventeen Years Of Fun
- The Importance Of Good Tools
- Temperature Shifts At Blue Hill, MA
- CO2²
- Time Of Observation Bias
- Climate Scamming For Profit
- Climate Scamming For Profit
- Back To The Future
- “records going back to 1961”
- Analyzing Rainfall At Asheville
Recent Comments
- arn on Climate Attribution Model
- Gordon Vigurs on Climate Attribution Model
- arn on Climate Attribution Model
- arn on Climate Attribution Model
- GW on Climate Attribution Model
- Gordon Vigurs on Climate Attribution Model
- conrad ziefle on Climate Attribution Model
- Robertvd on “Why Do You Resist?”
- arn on Climate Attribution Model
- Gordon Vigurs on Climate Attribution Model


lol, those long stick blades talking about the temps in the coming centuries always make me think of this song…….. a classic!
[youtube=http://www.youtube.com/watch?v=izQB2-Kmiic&w=640&h=390]
Why select 10 years and not 50 or 150 years? What do you think you can conclude about a 150 year trend from a purely empirical study of a single decade?
I hadn’t noticed that the “still to come” line was horizontal. My bad.
What can you conclude about an eight thousand year trend by looking at 150 years?
You need to look closer at your so called 150 year trend because in all likelihood the errors are greater than the reported trend and you fail to take into consideration that the globe is still attempting to recover from a cold period when glaciers were advancing that started about 1300.
Long term the globe is cooling with short periods of warming mixed in and the warming periods are getting shorter and cooler than the previous ones!
Your warming alarm claims were based on less than ten years of warming in 1988. Short term trends only show the problems with the Chicken Little position people like you have taken.
In reality, you can find out as much empirically about a trend in this data as you can about the stock market: nothing. You need to do the hard work of knowing what is going on.
Know anyone that’s doing that hard work?
That’s the problem with forecasting, if measurements go the wrong way it must be that the universe is wrong
Dan:
It is obvious that you do not!
If we look at the last 10,000 years then the world has been cooling. Takes you pick and makes your choice!
Look at 10,000 year trends and their associated drivers, but don’t confuse that with 150 year trends and quite different physics.
The Graph is BS because different smoothing Al-Gore-Rhythms were used to create the starting portion and the end portion. The Blade of the Hockey Stick should be a separate graph and the surface temperature record should have been separated also. The proxies were hand picked to support a predetermined position which removes the Dedro group from the realm of science. The surface temperature records are so corrupted by sea surface temperatures and UHI that are not a good reconstruction of historic temperature records. They appear to be a reconstruction of errors in the so called temperature record. I will be generous and give them an error rate of 2C which would mean the temperature might have risen 1C +/- 2C. However written historical records show the reported change was probably overstated because plants that once thrived in some regions can not be grown there at this time.
End result: No Global Warming!
Even over 150 years, we are talking about less than a degree (C) of warming. Since climate is never constant, that much warming over that long a period is nothing alarming, especially when increased urbanization is considered.
I asked the animals in my neighborhood, and they all said they hadn’t noticed a thing.
How do you quantitatively determine that less than a degree is large or small? Yearly variation is larger, but that is different than a change in average. When you mention urbanization are you referring to urban heat islands? Have you looked at the studies that have quantified this effect?
“Have you looked at the studies that have quantified this effect?”
=================================
I have, and their woefully inadequate. Dr. Spencer had a great start at it, but I haven’t heard of anymore from him in this regard. Typically when this happens, the study is in review for some journal or another….. Here’s a good start…. http://www.drroyspencer.com/2010/03/the-global-average-urban-heat-island-effect-in-2000-estimated-from-station-temperatures-and-population-density-data/
The discussion at WUWT would show some great questions and addendum to understanding what was presented, but you’d have to tediously sift through some of the less cerebral comments to get the nuggets.
I should have added that the discussion is linked at the addy I provided, and more links provided in the linked link……… I did say “tedious”. But that’s the game played.
I once started to document all of the relevant discussions and ideas regarding climate change in hopes to putting in a comprehensive order. Perhaps even in a book. Before I got past a handful of points of contention, dozens more had already been raised. And so it goes, even today……. I sometimes think studies like the Mannian hockey sticks and succhi disks are simply diversions to occupy skeptics in order to prevent them from addressing underlying reasons for such maniacal posits.
gotta love it….
the first 10 years were global warming….
…the last 10 years was an instrument error
1988-1998 temps went up
1998-2011 temps went down