Marc Morano sent this over
Penn researchers link fastest sea-level rise in 2 millennia to increasing temperatures
PHILADELPHIA — An international research team including University of Pennsylvania scientists has shown that the rate of sea-level rise along the U.S. Atlantic coast is greater now than at any time in the past 2,000 years and that there is a consistent link between changes in global mean surface temperature and sea level.
The research was conducted by members of the Department of Earth and Environmental Science in Penn’s School of Arts and Science: Benjamin Horton, associate professor and director of the Sea Level Research Laboratory, and postdoctoral fellow Andr ew Kemp, now at Yale University’s Climate and Energy Institute.
Their work will be published in the journal Proceedings of the National Academy of Sciences on June 20.
I’ll start with Maine and work my way down the coast. PSMSL has three long-term tide gauges in Maine. All of them show that sea level rise rates dropped around 1980. Also note that all the graphs end at the peak of El Nino in 2010. Sea level has plummeted since then.
There aren’t any tide gauges in New Hampshire. Boston shows that sea level rose much faster prior to 1950 than it has since.
Martha’s Vineyard rose faster prior to 1970.
Newport, Rhode Island rose faster prior to 1950
Providence, Rhode Island has not accelerated.
New London, CT shows no increase in rise rates.
Bridgeport, CT rose faster prior to 1970
New York rise rates haven’t changed for 150 years. They are mainly due to land sinking from groundwater pumping.

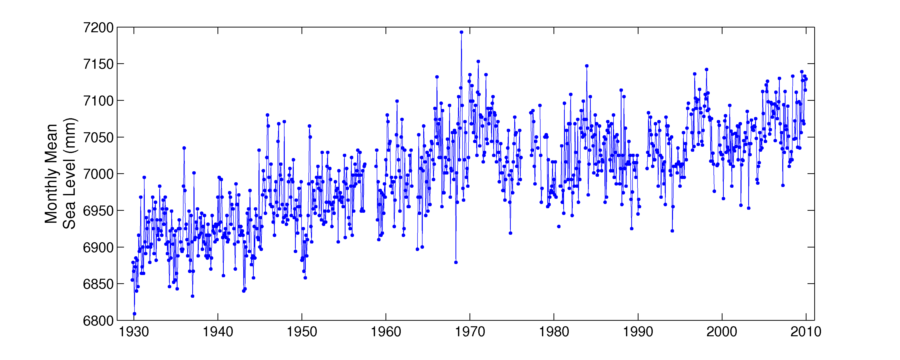
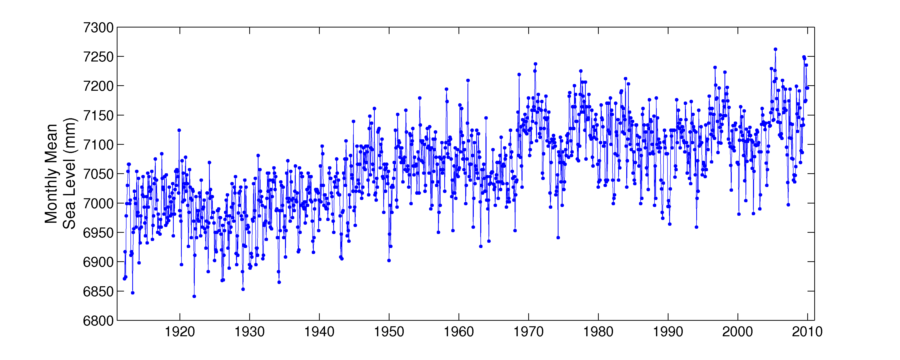
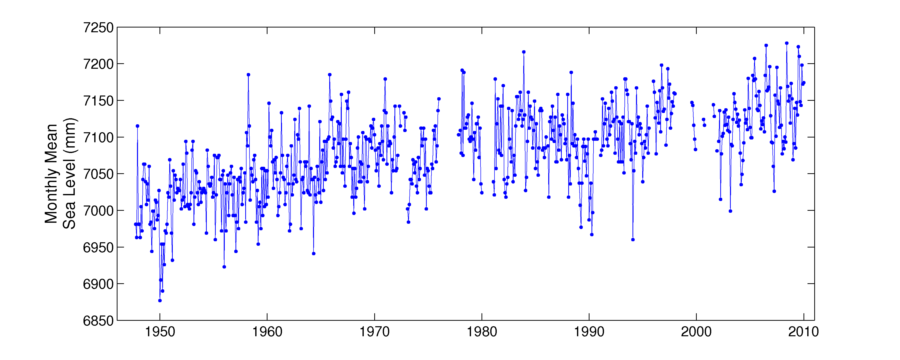
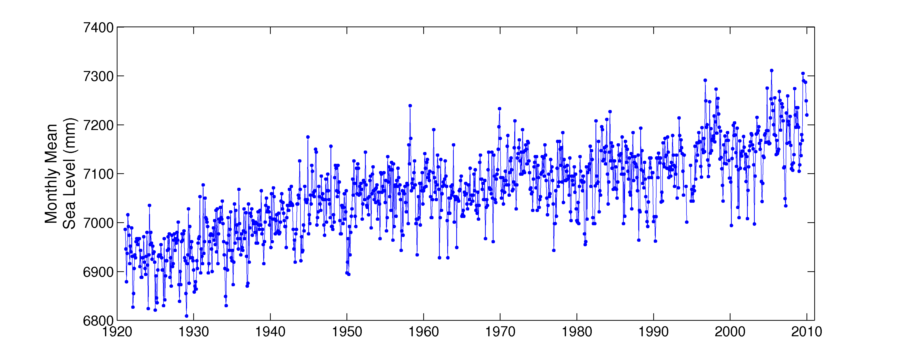
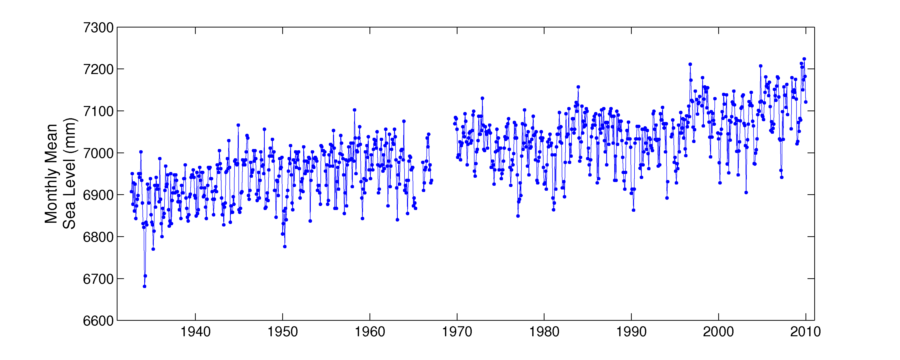
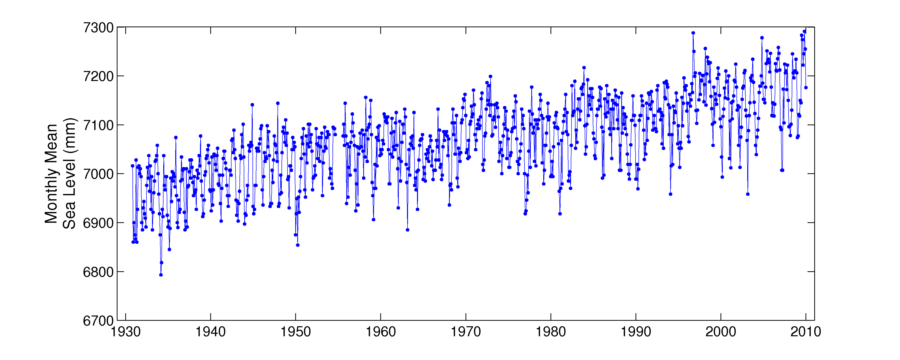
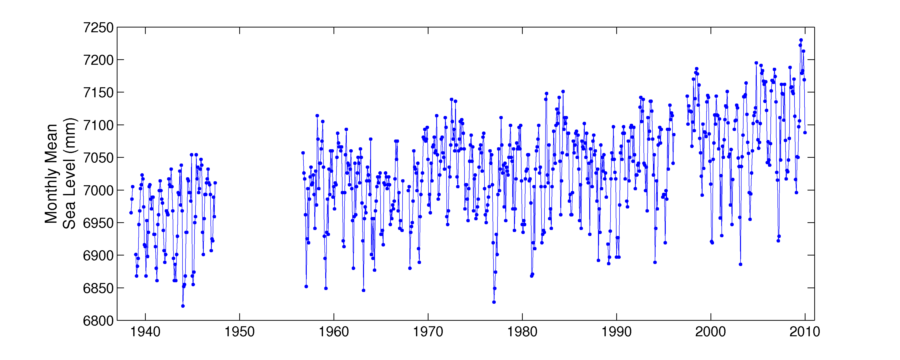
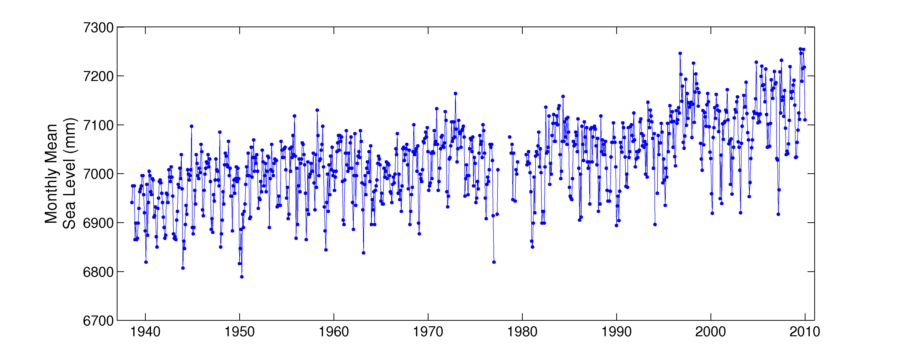
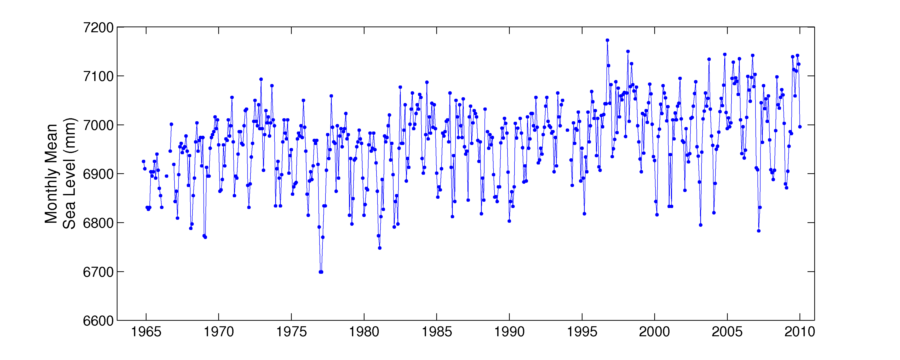
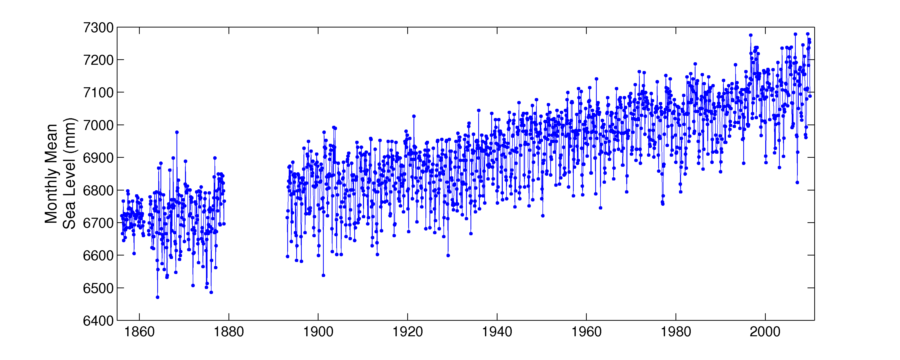

Yes…..I can certainly see what you are talking about. All three charts go from the lower left, and trend up to the upper right. I don’t know WHERE the leftstream media gets the idea that oceans are rising, islands are slowing being enveloped, and coastal waters are slowing rising.
What is wrong with those idiots? Next thing you know they will be saying that hydraulic fracturing (“fracking”) for natural gas is bad for the environment because it poisons the water AND releases methane into the environment which makes global warming worse. The truth be told, we all know that the drilling companies sprinkle “pixie dust” where they drill which makes everything hunky dory. And I KNOW that Chuck and Dave Kockhead are into a lot of fracking.
But I like the charts…..
What part of “rate of sea-level rise” do you not understand? Are all alarmists dope smoking addicts?
Steve, didn’t highlight “the rate of”, that threw him off…………
lol, you’re right Lat…….. entirely Steve’s fault for being intentionally confusing. It’s often trick to associate fastest with rate, or to actually read all the words. If Steve just wasn’t so verbose………..lol
Actually, I shouldn’t be that short with people, the pain meds are wearing off…….about time for another happy pill!!! 😀
Islands like the Maldives who newly minted “Greenpeace-gate” skeptic Mark Lynas organized an underwater board meeting in scuba suits? Let’s have a look at it’s tide gauge and those that surround it, shall we?
http://oi56.tinypic.com/rc6n34.jpg
Gosh, the maldives are sinking but actual sea level around them is not rising at all.
Oh lord, you should *hear* the invective bile that is created when I posts sea level charts on AGW enthusiast sites!
Now we have to suffer a sea level hockey stick? Ugh.
Here is a simple question that has never crossed the mind of Chris Smith. Wait for it …
.
.
.
.
.
.
.
What *should* the charts being showing us?
Do you mean, “given that AGW allegedly started in the 1970’s and is allegedly accelerating?”
No, I mean from *any* date since this interglacial began. From any date, the chart must go from ‘lower left to upper right’
Sea Level is either …
A) Rising
B) Lowering
C) Staying the same.
What *should* Sea Level be doing?
It is not a trick question.
The lies told by purported scientists are increasing at a faster rate than any time during the past 2,000 years. The last couple years, the lying has been increasing super-exponentially.
Dear Ms or Mr Smith, if you walk in the middle of these blue lines from left to right, and if the rate of sea-level rise increases, you would make a curve to the left. But you do not, you go straight.
And the MSM do not tell us that the “coastal waters are slowing rising”. They tell us that they are fasting rising.
Using sea level rise rates as a proxy for temperature, I’ve confirmed that there has been no warming…
-Scott
Are those graphs unadjusted? tsk tsk
I feel that Eastport, Maine and Portland, Maine should track each other pretty faithfully, but to my mkI eyeball, they didn’t appear to. So I dowloaded the monthly data and plotted them together. They do track, but not well, so I calculated the differences and plotted them. Strangely there’s a low frequency component of 10 cycles per year. (Again, that’s by
eye. I was a radio technician, so I know a wave when I see one.) If it was 12 cycles per year, I’d attribute it to the Moon – but it isn’t. Could it be an artifact of statistical processing?
Could it be a new natural phenomena I’ve discovered? Or could it be a fiddle factor?
This is what I’m on about …
http://www.flickr.com/photos/7360644@N07/5849481975/in/set-72157626128752488
Sea level has risen an average of 4 feet per century since the end of the Ice Age: 420 feet in 100 centuries. Fortunately, almost all of it occurred in a short period 10,000 years to 8,000 years ago. Since then sea level reached 10 to 20 feet higher than now during the 10 degrees warmer Holocene Optimum until reaching a peak about 3,000 years ago, then started falling. However, the Medieval Warm Period featured 12th Century sea levels eight inches higher than now, the Little Ice Age had sea levels 12 inches lower, and for the past four centuries sea levels have been increasing an average of six inches per century, and the rate of increase has been falling in the past half century.
It doesn’t appear that this study reflects the sea level history going back 10,000 years when sea level was 420 feet lower, or the fluctuations in the six periods of warming in that period, of which the current period is the least. The only thing that makes the current warming seem remarkable is that it follows the Little Ice Age, which was the coldest period since the end of the Ice Age. We have actually been on a cooling trend since the end of the Holocene Optimum about 4,000 years ago; each succeeding warm period has been cooler than the preceding.
None of this is conjecture about atmospheric carbon dioxide; it was much lower than now even though average temperature was higher. None of this requires computer models; it’s all been compiled in studies reported voluminously in books such as H H Lamb’s “Climatic History and the Future” published in 1977. No trees had to be bored and cored, and analyzed for growth factors such as moisture, temperature, carbon dioxide fertilization, divergence from the instrumental record, and the like. Instead, such records as crops – vineyards in England 1,000 years ago – glacier retreat and advance, coral mounts that were 10 feet above current sea level 3,000 years ago, and sediments that indicated ocean temperature was 10 degrees Fahrenheit warmer then.
These current studies seem detached from other science and climatic history. They exist in a land of make believe, where what you desire now changes the past to fit the present.
Soviet historians did this whenever present facts made an event in the past an inconvenient truth. I thought that all ended around 1984, but “science” seems to have picked it up as the Soviet Union collapsed. Perhaps science will be next…
I enjoyed reading that.