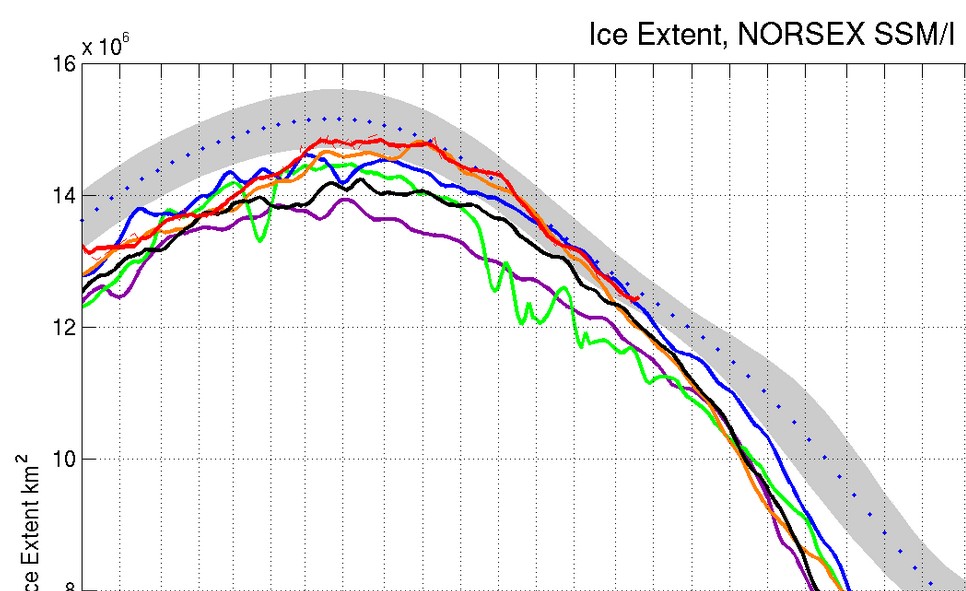
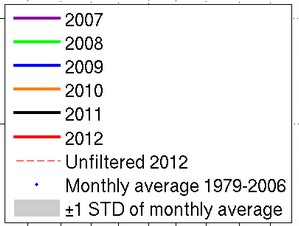
Highest extent since at least 2006
Disrupting the Borg is expensive and time consuming!
Google Search
-
Recent Posts
- Gaslighting 1924
- “Why Do You Resist?”
- Climate Attribution Model
- Fact Checking NASA
- Fact Checking Grok
- Fact Checking The New York Times
- New Visitech Features
- Ice-Free Arctic By 2014
- Debt-Free US Treasury Forecast
- Analyzing Big City Crime (Part 2)
- Analyzing Big City Crime
- UK Migration Caused By Global Warming
- Climate Attribution In Greece
- “Brown: ’50 days to save world'”
- The Catastrophic Influence of Bovine Methane Emissions on Extraterrestrial Climate Patterns
- Posting On X
- Seventeen Years Of Fun
- The Importance Of Good Tools
- Temperature Shifts At Blue Hill, MA
- CO2²
- Time Of Observation Bias
- Climate Scamming For Profit
- Climate Scamming For Profit
- Back To The Future
- “records going back to 1961”
Recent Comments
- Bob G on Gaslighting 1924
- Bob G on Gaslighting 1924
- Bob G on Gaslighting 1924
- conrad ziefle on Gaslighting 1924
- Bob G on Gaslighting 1924
- Bob G on Gaslighting 1924
- arn on Gaslighting 1924
- conrad ziefle on Gaslighting 1924
- Gordon Vigurs on Gaslighting 1924
- conrad ziefle on Gaslighting 1924


Steve,
I know you’ve always been keen on PIPS as a measure of sea ice. I just tried to visit the PIPS 2.0 site and I was asked for authentication (which of course I don’t have). Have you noticed the same?
Cheers,
Rich.
Yes, they have locked us out of PIPS2. Fortunately I downloaded much of their database before they did it.
What about PIPS 3? Or whatever the site was you were using last year?
-Scott
The extent this time of year isn’t too predictive of what’s to come, particularly when looking at day-to-day noise. For instance, up until about now JAXA has 2004 and 2006 being lower than 2007, and around today they finally “catch” 2007 and are about equal. The poor correlation is shown quantitatively by R^2 value between May 27th extents and the minimum values…a very low 0.083.
Of course, looking at day-to-day noise is way better than saying if weather is similar to 2007 then there’s a very good chance of seeing “ice-free” conditions this year, as was said by Neven(?) here:
http://wattsupwiththat.com/2012/05/12/the-arctic-ocean-could-be-nearly-ice-free-at-the-end-of-summer-by-2012/#comment-984025
I really don’t get this comment because his much-loved PIOMAS has total volume essentially identical with 2011, so at a first approximation his statement should hold for 2011 too. 2011 had pretty bad weather for the ice most of the summer, except for 3-4 weeks of good weather. Yet it still finished 3.5 million km^2 above what he considers “ice free”. So if those 3-4 weeks had bad weather instead, would they have averaged 1 million km^2 extra loss per week? I’ll let the reader decide that. Clearly, one has to believe that Arctic is truly at a tipping point if they’ll believe the linked statement… I think that kind of thought is currently being justified on Neven’s blog by commenters saying that the only thicker ice is in locations essentially guaranteed to melt out, whereas the main basin is super thin.
Right now, I’m guessing a 2008-like final number. Exact prediction plus uncertainty to come in a few weeks…
-Scott
Anyone heard from Julienne lately?
Better get Serreze on the Batphone. The death spiral is in danger of unraveling. You just can’t plan a good clean crisis anymore. I remember that Joe Bastardi noted the recovery from the minimum would probably occur two steps forward, one step back…. and that’s exactly what we’ve seen.