Comment from from Judith Curry’s blog.
lolwot | May 25, 2012 at 4:02 am
The first two graphs Steven Goddard compares are a graph of Northern Hemisphere Temperatures with A graph of 90N-23.6N temperatures. What’s that? Not the same thing is it. Close, but not the same. It’s strange because on the GISTEMP site Hansen has put Northern Hemisphere graphs. Why does Goddard pick a 90N-23.6N one instead? That’s sloppy at best.
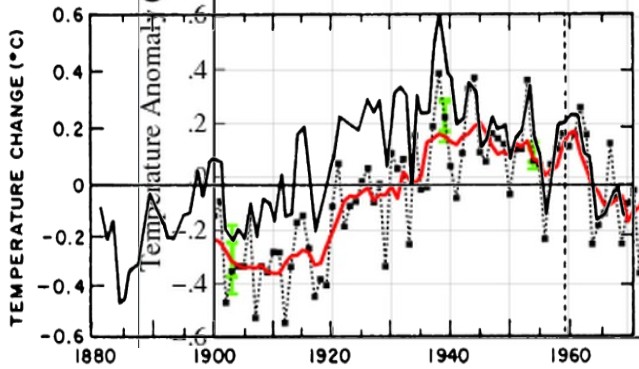
Below is the graph he is referring to. (BTW – If I could find a Hansen Northern Hemisphere graph I would use it, because it would make the distortion even more pronounced. Unfortunately the GISTEMP site does not have a clean NH graph.)

Hansen – The Climate Chiropractor | Real Science
The argument that he is making is that Hansen’s inclusion of the tropics radically changes the shape of the graph.
Here is some remedial math and science to help out wooltwat. The tropics always show the smallest temperature change. If you add in the small numbers from the tropics (whatever they are) it won’t have a significant effect on the shape of the graph, because their small magnitude causes them to be weighted minimally. Even worse, he is claiming that the addition of small magnitude numbers has increased the magnitude. For example, NAS showed the 1910 temperature deviation as being -0.1, but Hansen shows it as -0.4. How does the inclusion of a group of small magnitude numbers cause the magnitude to quadruple?
Hansen creates his phony graphs by cooling the high latitudes (as shown below) which always show much larger variations in temperature than near the equator. Polar amplification causes the temperature records north of 23.6 to be weighted much more heavily. Hansen fully understands that temperatures in the tropics have a minimal effect on the shape of the temperature graphs, and that is why he doesn’t focus on them.

This is what Hansen is hiding from 1900 to 1940.
it was concluded that near Polar temperatures are on an average six degrees higher than those registered by Nansen 40 years ago. Ice measurements were on an average only 6½ feet against from 9¼ to 13 feet.
Our lukewarmer friends say that Hansen’s data tampering is all golden.

So then because thou art lukewarm, and neither cold nor hot, I will spue thee out of my mouth
Revelation 3:16


Warmists accept the premise that whatever junk science they like simply cannot be wrong. Then they work backwards from that, doing a lot of armchair speculation on why any critique (no matter how straightforward or obvious) cannot be sustained.
Steven “can’t see the forest for the trees” has to be one of the most annoying of the lot. Great at examining in detail but can’t (or wont’) put the details together. As a detective, he would be a serial killers best friend.
Steven “can’t see the forest for the trees” Mosher that is.
I think he developed a Stockholm syndrome to his model. Most modelers do.
It’s sad to see otherwise decent scientists rush to the defense of self-serving scam artists who have spent the bulk of their careers scaring the bejeebers out of people by trotting out manipulated temperature and proxy data. The shady activities of the Climategate team are on par with those of an organized crime syndicate. In a sane world, these temperature tricksters would be prosecuted for fraud. Instead, they are defended by lukewarmists and others in academia who willingly tarnish their reputations in a shameful attempt to excuse scientific malfeasance.
@ kirkmyers “The shady activities of the Climategate team are on par with those of an organized crime syndicate.”
That is a slur on organized crime syndicates. Say what you will about such criminal syndicates, but at least they do not force you (through legislation) to do business with them, nor do they tell you that they are breaking your legs for your own good.