
Since March 1, Arctic ice extent has been within one standard deviation of normal, on its way to an ice-free state this summer.
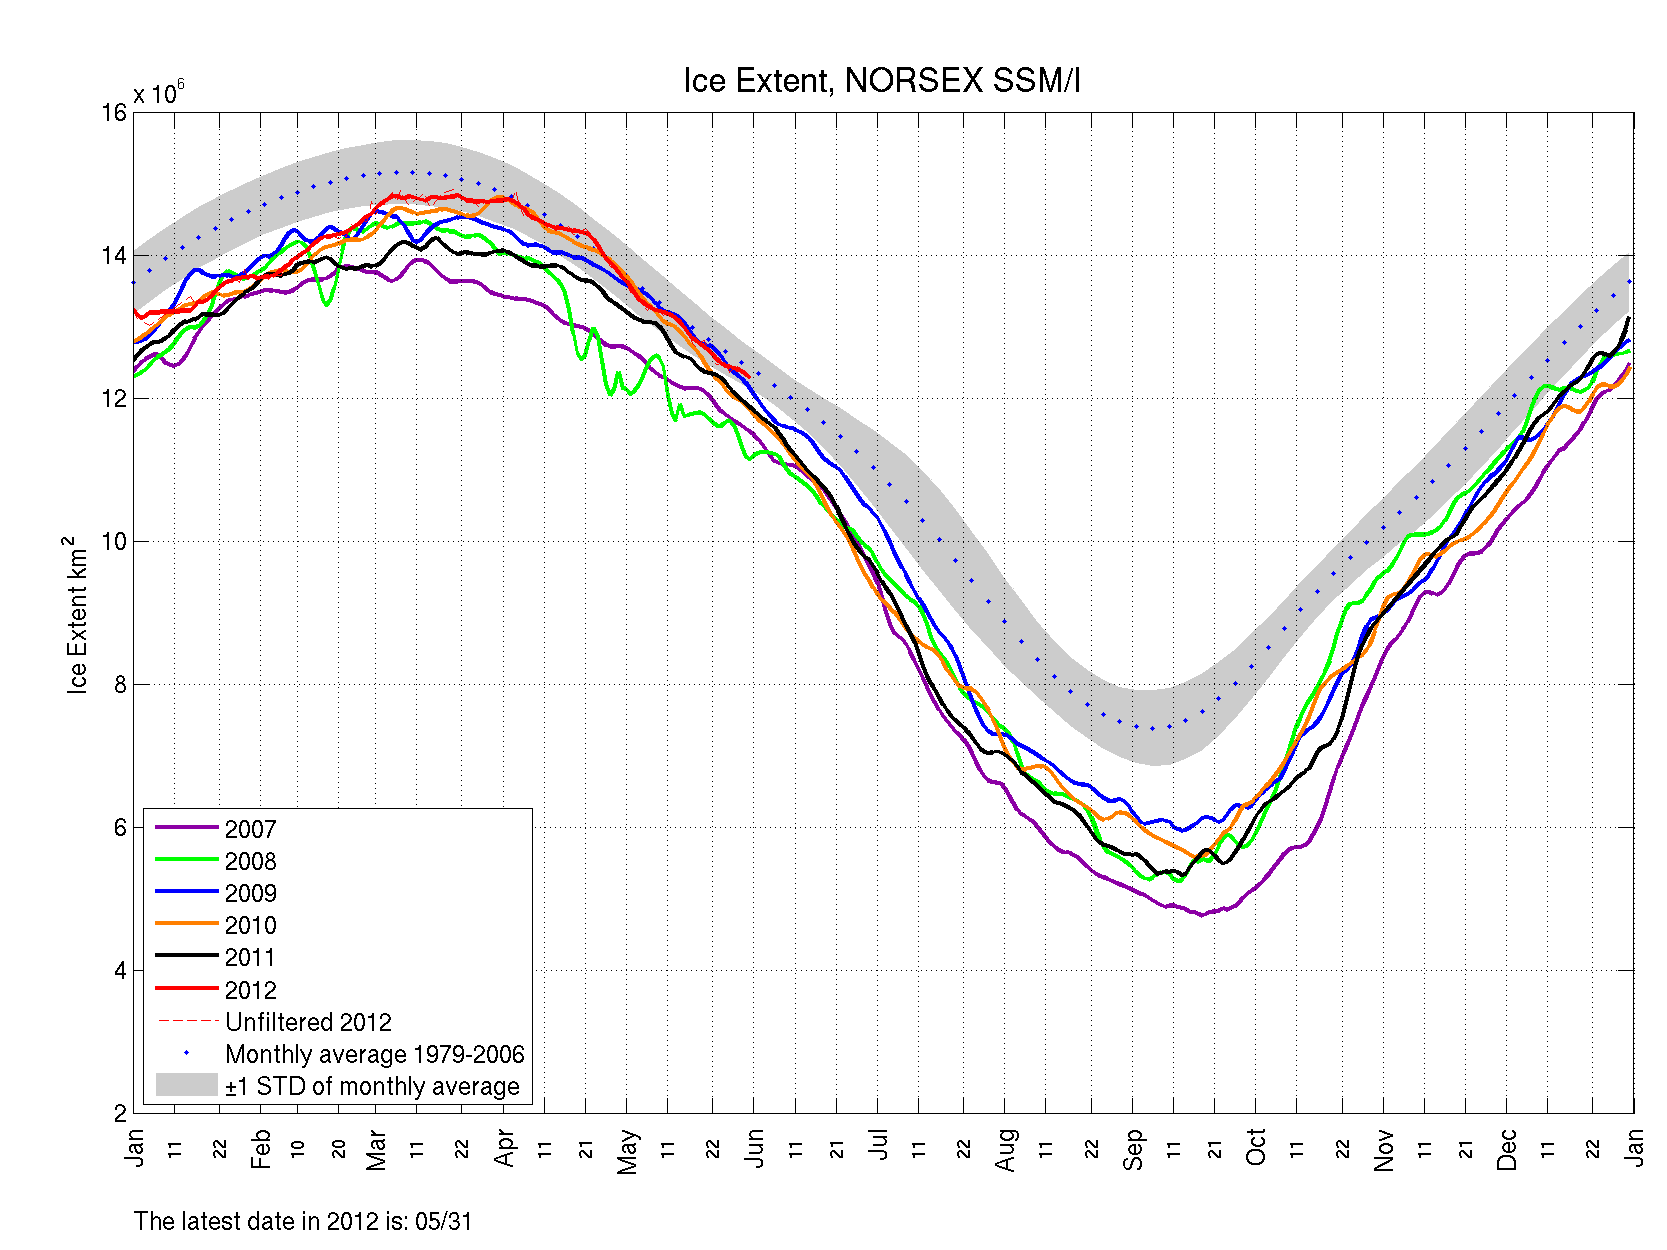
Since March 1, Arctic ice extent has been within one standard deviation of normal, on its way to an ice-free state this summer.


I hope youall realize that this unprecedented amount of normal Arctic ice extent continues to the tipping point that will plunge the entire global climate system to a death spiral of uncontrolled normal weather.
Just think, we’ll face multiple decades of flood, drought, hurricanes, cold, and polar bears. If that’s not bad enough, think of your children’s future and their children’s and what they will have to endure – catastrophically uncontrolled and accelerating global climate normalcy!
/sarc-off
The British Empire became the Commonwealth and so this summer in the UK we have to make do with a Prince with no clothes.
Sadly I fear that he will be the very last of the believers.
Fortunately he has few executive powers, otherwise he would be dangerous.
These graphs show the trend not looking quite so rosy as on the chart above…
http://www.ijis.iarc.uaf.edu/seaice/extent/Sea_Ice_Extent_L.png
http://arctic-roos.org/observations/satellite-data/sea-ice/observation_images/ssmi1_ice_area.png
My guess, having followed the “death spiral” rather closely, is that we will see significantly more ice on the Pacific side at minimum than usual, and perhaps less on the Atlantic side. What that amounts to overall is anybody’s guess…
Also, since this is my first post on this site, I should say: fantastic blog Steve, read it every day, keep up the good work!
Thanks!