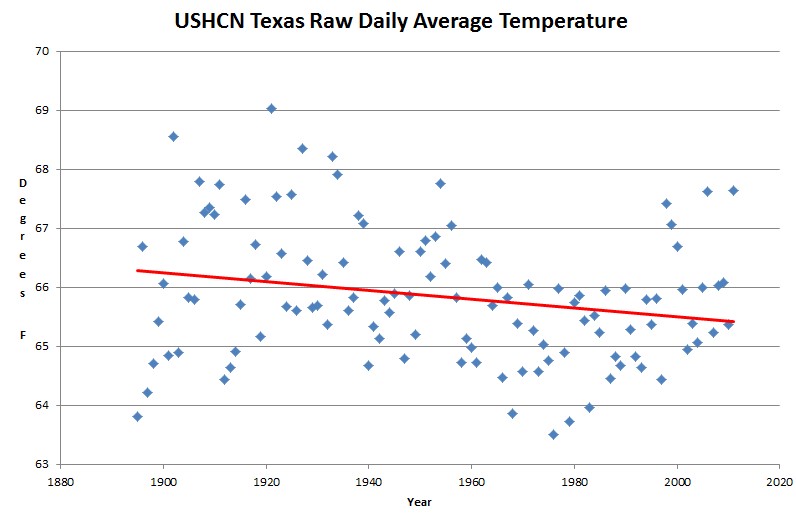
USHCN daily temperature data averaged over all stations in Texas show that temperatures have been in decline since 1895.
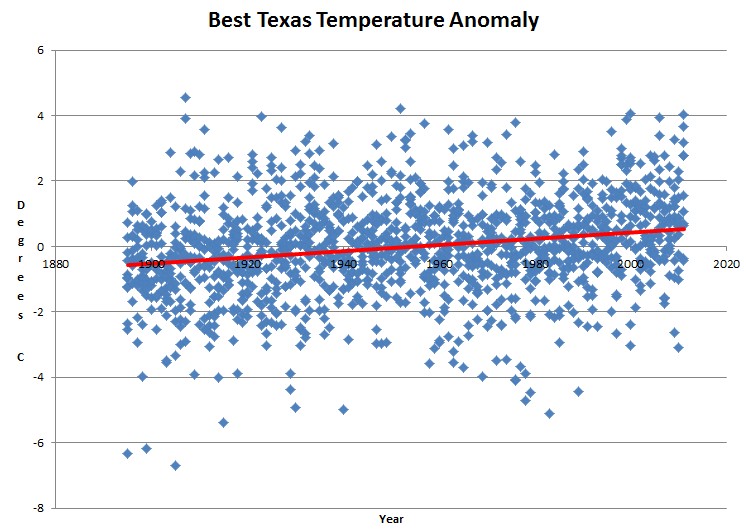
Muller’s Best Worst temperature data shows the exact opposite.
It looks like Best is using the same crap data as GHCN
How can anyone take this temperature data seriously? It is literally all over the map.


Hey Steven , those people think the truth is valuable and therefor use it as little as possible .
Mosh said there were more thermometers in the data set. Told me to check out the colonial thermometers. I went looking for them, but the instructions are so vague I couldn’t find them. Mosh being who he is, didn’t elucidate. But, I’m pretty sure they simply pulled some stuff out of …. well. They can give us global temps going back to 1750 dontcha know?
I saw that. Temperatures in Oklahoma from 1750 – taken by Cherokee no doubt.
Hey suyts , I’m reaching here , what was a colonial thermometer ? I was under the impression that thermometers didn’t get invented until the 1800s . Was a colonial thermometer a glass of water on the table and if it froze it was below freezing ? When did people start having fairly accurate methods of measuring temperature ?
They were in invented long before that; in the early 1600’s, but they didn’t have a proper scale until 1724.
Worse still, the first registering thermometer was invented in 1782. Unless someone was checking each thermometer every few minutes, I doubt any measurements taken before that date are reliable.
If that is the case, then we should know the real world temperature to three decimal points back to the Inca empire and the Vikings in Greenland.
Why are they limiting their imaginations to global temperature in 1750 when they can go so much further back using their procedures.
As far as that goes , I think they should be telling us what the temperature was when the first humans first walked this earth.
Frankly speaking, the United Nations and the entire structure of post-WWII government science in the US, the UK, and the EU were designed “From Where The Sun Never Shines”, out of fear of a source of energy, “Brighter than a Thousand Suns”, that vaporized Hiroshima on 6 Aug 1945 and then Nagasaki on 9 Aug 1945.
The United Nations was officially established on 24 Oct 1945, with leaders of the impending Cold War seated as permanent members of the all powerful UN Security Council – the UK, the USSR, the USA, China and France.
Fear of reality, truth, God – – – the enormous energy (E) stored as mass (m in cores of heavy atoms and stars – – – caused world leaders and leaders of the scientific community to hide, manipulate, ignore or distort experimental observations and measurements that might expose reality, truth, God after 1945.
Here are brief summaries of data and observations that were purposely obscured:
http://omanuel.wordpress.com/
http://omanuel.wordpress.com/about/#comment-720
The Apeiron Journal 19, 123-150 (2012) http://tinyurl.com/7t5ojrn
Here is a 1998 CSPAN video recording of evidence NASA purposely hid isotope data from the $1,000,000,000 Galileo probe that entered Jupiter in 1995 – to obscure the Sun’s energy source:
http://www.youtube.com/watch?v=m3VIFmZpFco
With kind regards,
Oliver K. Manuel
Former NASA Principal
Investigator for Apollo
http://www.omatumr.com
The raw data has well-documented biases.
http://www.ncdc.noaa.gov/cmb-faq/temperature-monitoring.html
One cannot used incorrect data to argue against BEST or any other data set. One needs to use the correct data to measure the reliability of the various data sets.
Modern day agenda driven climate “scientists” have well documented biases, much more so than raw data. Going back well over 100 years, there have been guidlines as far as the correct way to measure temperatures. Well ventilated shelter, 6 feet off the ground, away from buildings, etc.
I would trust a reading from Farmer Jones’ back yard in 1912, before I would trust any reading from Reagen National Airport. Near a river, near jet exhaust, in an asphalt jungle, huge amount of AC exhaust, no vegetation, agenda driven fanatics running the show, etc. etc.
Satellite data and ice core data (both unbiased and measured with modern instruments) show a clear warming of the entire earth.
NOAA did a study to see whether the stations near airports changed anything, and once removed they really didn’t.
Plus the US is 2% of the entire Earth’s surface, so going by trends in the US or stations in the US to determine global temperatures is pretty silly but people like Goddard often do that to say that the Earth is cooling, which it obviously is not.
Get a clue. Satellite data starts in 1979 – the coldest year since the 1910s. Ice core data shows no such thing. You are completely FOS
“Get a clue. Satellite data starts in 1979 – the coldest year since the 1910s. Ice core data shows no such thing. You are completely FOS ”
I wasn’t sure if this claim was true or not. So, I decided to look it up:
http://www.nature.com/scitable/content/ne0000/ne0000/ne0000/ne0000/45903692/1_2.png
I’m going to side with Nature on this one.
Don’t make claims that are easily refutable with 30 seconds of searching on google.
Brilliant logic. You take upwards bogus adjusted data to prove that the bogus upwards adjusted data is correct.
“NOAA (a clearly agenda driven group, known to lie and cheat) did a study did a study to see whether the stations near airports changed anything and once removed (according to the cheaters) they really didn’t”. Just like the original Penn State interal investigation that said once Sandusky was (sort of) removed that the number of child rapes really didn’t change.
Idea: Take GHCN adjusted minus USHCN adjusted. Each data point in each data set represents the “gold standard” of “consensus estimates” of the true temperature, without all bias, from thousands of data points. The difference of each pair, is the error between the data sets for the year. These average errors should be randomly distributed and since both individual sets are “near perfect”, the error between them represents measurement error since all known biases are removed. To get an idea of individual measurement error, multiply by ((n1-1)*(n2-1))^0.5 (I’d have to look that up to be sure, but it will get you close). This will demonstrate that the errors in the individual datasets are huge if the differences between them are large.