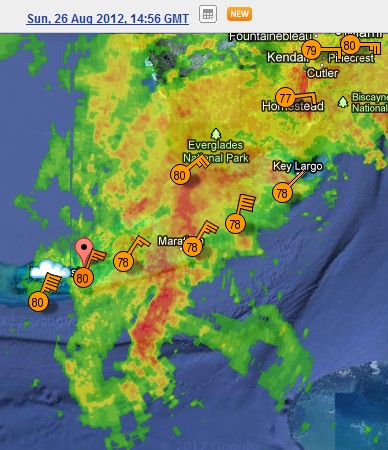
Issac is about to cross the Florida Keys. NOAA reports 65 MPH, which is 15 MPH higher than any station is recording.
Disrupting the Borg is expensive and time consuming!
Google Search
-
Recent Posts
- “Why Do You Resist?”
- Climate Attribution Model
- Fact Checking NASA
- Fact Checking Grok
- Fact Checking The New York Times
- New Visitech Features
- Ice-Free Arctic By 2014
- Debt-Free US Treasury Forecast
- Analyzing Big City Crime (Part 2)
- Analyzing Big City Crime
- UK Migration Caused By Global Warming
- Climate Attribution In Greece
- “Brown: ’50 days to save world'”
- The Catastrophic Influence of Bovine Methane Emissions on Extraterrestrial Climate Patterns
- Posting On X
- Seventeen Years Of Fun
- The Importance Of Good Tools
- Temperature Shifts At Blue Hill, MA
- CO2²
- Time Of Observation Bias
- Climate Scamming For Profit
- Climate Scamming For Profit
- Back To The Future
- “records going back to 1961”
- Analyzing Rainfall At Asheville
Recent Comments
- Bob G on Climate Attribution Model
- Robertvd on “Why Do You Resist?”
- arn on “Why Do You Resist?”
- Gamecock on “Why Do You Resist?”
- Bob G on Climate Attribution Model
- Gordon Vigurs on Climate Attribution Model
- Bob G on Climate Attribution Model
- John Francis on “Why Do You Resist?”
- Gordon Vigurs on Climate Attribution Model
- Luigi on Climate Attribution Model


At NOAA , they intuitively know what any hurricane is doing . I mean look at their track record .
I’m hoping I don’t need a sarc label on that .
The latest reconnaissance estimated maximum sustained winds of 56 knots. The detailed information from the preceding flight had maximum winds about 50 nautical miles northeast of the center over open waters; the most recent data at that level of analysis isn’t in yet.
In any case, the most recent vortex report is below:
000
URNT12 KNHC 261602 CCA
VORTEX DATA MESSAGE AL092012
A. 26/15:27:10Z
B. 23 deg 38 min N
080 deg 57 min W
C. 850 mb 1393 m
D. 56 kt
E. 351 deg 56 nm
F. 058 deg 48 kt
G. 341 deg 61 nm
H. 996 mb
I. 19 C / 1401 m
J. 20 C / 1524 m
K. 16 C / NA
L. NA
M. NA
N. 12345 / 8
O. 0.02 / 5 nm
P. AF309 2109A ISAAC OB 06 CCA
MAX OUTBOUND AND MAX FL WIND 50 KT E QUAD 15:35:30Z
;
I’ve been following the surface wind speeds too from the NOAA buoys. http://www.ndbc.noaa.gov/radial_search.php?storm=at4
44 knts / 49-50 mph is the highest reported observation from the surface buoys. I imagine their 65 is based on models from altitude.
Wouldn’t surprise me a bit if they would apply their ‘model corrections’ to the real empirically measured data. Gotta realize that the US CAGW zealots are suffering from 7yrs of ‘hurricane deprivation’. Anything to alleviate that horrible pain.
The National Hurricane Center’s advisories have nothing to do with climate change.
Other than the fact that the NHC is also part of NOAA, like the NCDC which ‘adjusts’ climate empirical historical temp data. And NOAA promotes the climate scare.
Just to be clear. I didn’t mean to indicate that the NHC, NOAA were CAGW zealots. I was referring to Romm, Foster aka Tamino, Hansen, Mann, etc. who were suffering from ‘hurricane deprivation’.
Are the grphics on the map in Km per hour? They seem to be indicating 80, if metric that would be about 50mph as Steve states.
Andy
You are looking at the temperature in F, not the wind speed.
why not show maps with wind speed?
The wind speed is shown by the flags.
I always like it when commenters like Andy show they don’t know what they are doing.
checked out the Duval street cam. Light rain and not much wind. People in front of the bar/cam waving.
Regarding the Irene debacle, here is a link to the poor reporter getting covered in green slime (raw sewage) .https://www.youtube.com/watch?v=bKIr61nNb3o
Off topic, USGS is reporting nothing except by computer, about the 40 or so quakes > 2.5 in the last 4 hours (4 very strong) at Brawley. sigh