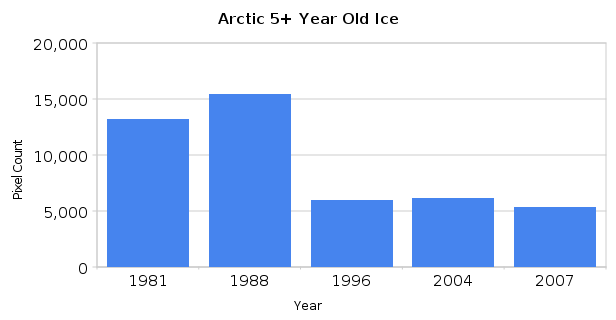
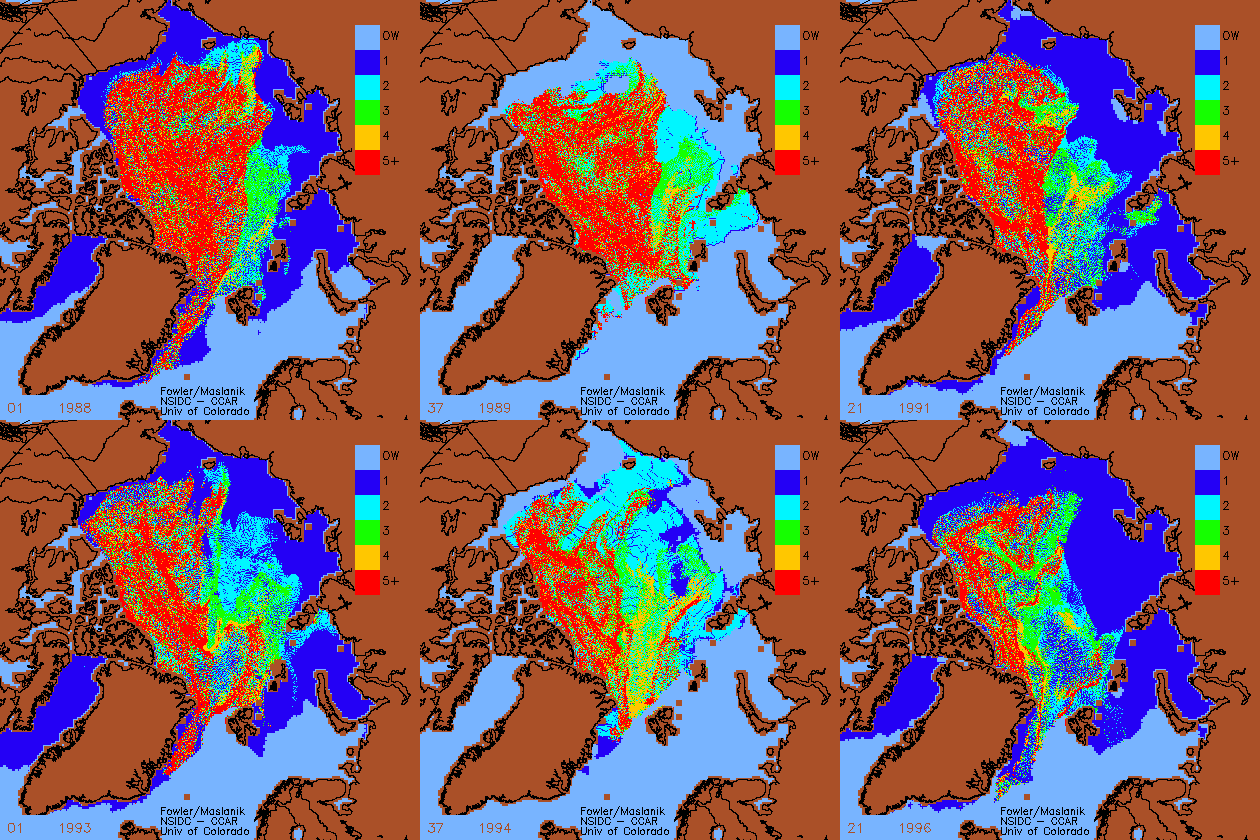
The vast majority of multi-year ice is lost during the winter, not the summer. Winter winds blow the thick ice out into the North Atlantic where it melts when it contacts warmer water.
Between 1988 and 1996, two thirds of the five year old ice disappeared.
2007_seaiceminimum/images/20070822_oldice.gif

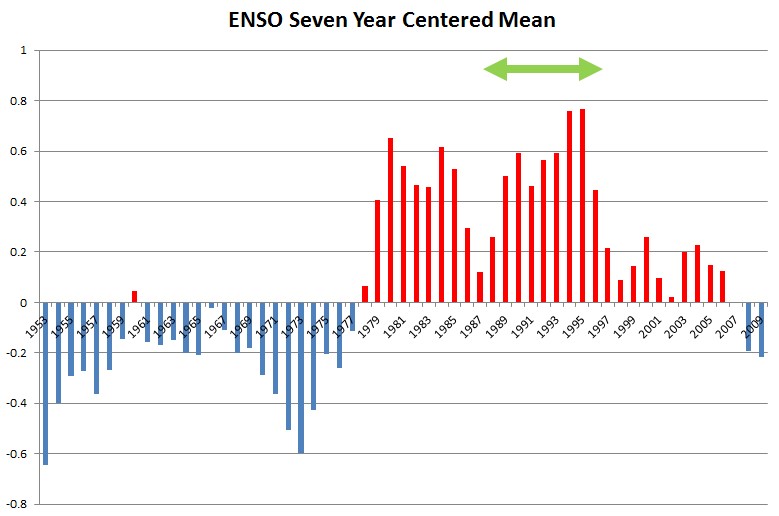
This has lead to a reduction in summer extent, because the ice in the Chukchi and Beaufort Seas is thinner than it was twenty years ago. The reduction from 1988 to 1996 coincided with the highest ENSO period on record. Conveniently for NSIDC, the satellites they cherry-pick were launched just as ENSO went positive. This has allowed them to show a continuous downwards trend in ice extent.
ENSO is dominantly negative since 2008, and the amount of multi-year ice is increasing again.
October | 2011 | Arctic Sea Ice News and Analysis
Alarmists are hysterical about the “record minimum” extent, but it probably is meaningless for the long term.


Alarmists are hysterical about the “record minimum” extent, but it probably is meaningless for the long term.
Alarmism always turns out to be meaningless
A bunch of islands formed by still active volcanoes? I see them too.
http://www.wired.com/rawfile/wp-content/gallery/eruption-1000/IMG_2017k.jpg
I dub the Arctic sea ice, mistakenly called by laypeople an “ice cap,” a “knit beanie” in my book “Don’t Sell Your Coat.” If it weren’t perennially fraying and getting stitched back together in the darkness of winter (notwithstanding both wintertime and summertime melt), then at the dawn of the Modern Warm Period you would have found ice that was centuries, or millennia, old. The absence of such “paleo” sea ice establishes the normalcy of cyclical melting in and of itself.
Just for the record Steven, are you saying that multiyear ice is increasing because ENSO is dominantly negative? Is this so you can then suggest when the final figures for 2012 arrive in a couple of weeks, you will be able to say the inevitable loss of multiyear ice this September was due to the fairly neutral ENSO we have experienced this year? Or is the 7 year centred mean for ENSO this year still negative?
I’d say that you are talking jibberish
I’m sorry that you don’t understand Steven. You see, the problem is, I’m not 100% clear on what you are saying in this post and I genuinely want your clarification on something. For 2012, is ENSO dominantly negative?
The graph is the seven year centered mean current through August.
Why August and not September?
I sense another time wasting attack
Actually forget that. When you’re dealing with ENSO, August or September doesn’t make any difference. My error. My next question is, are you predicting that because our 7 year mean for ENSO is negative that we can expect to see a continued upward trend in MYI?
I am making observations
It’s been my observation that when event A doesn’t exactly occur at time period B, there is a tendency to appeal to ‘lags’ in the climate system.
Is Steven not drawing a direct parallel between his two graphs? If so, I see no lag.
‘Direct parallel’ ? I think he is looking at an interesting correlation. What about factoring in volcanic eruptions, stormy weather over certain time periods, changes in pollution output from China, etc. Does the data need to be ‘adjusted’ to consider these factors? On the other hand, maybe it’s just an interesting coincidence. That’s climate science for you.
I fully understand that correlation does not necessarily equal causation and it may well be just a coincidence. In fact I’m extremely confident that it is. I am curious as to what Steve is asserting in this post? The way it reads suggests he is assuming causation. If that isn’t the case then he probably needs to say so, but I suspect that is indeed what he is suggesting, in which case, it will be interesting to see if he can admit he was wrong if, after the data from this year’s ice loss shows a large drop in MYI.
I’m extremely confident that you are here to waste my time
uknowispeaksense
Slow down a little and think about it.
I think his point is clear: he stated that the “record” minimum extent is meaningless in the long term.
uh huh..”…the long term…” The post suggests it is cyclical and tied to ENSO in short timeframes and then finishes with a vague statement that leaves plenty of wriggle room. That way, if the ice suddenly makes a miraculous turn around next year he can point and say “see how clever I am” and when it continues on its in evitable death spiral over the next decade, this post will be long forgotten. Oh well.
“when it continues on its in evitable death spiral over the next decade”
Whenever I read a comment from someone who declares he is 100% certain about what will happen in the future (especially the weather), or is, say, “extremely confident” about matters for which no certainty is possible, I know they have been smoking the wacky weed again. 🙂
Cherry picking the cause of the day for maximum effect while ignoring everything that would shut the alarmist cake holes! Now ugoblowadonkey err something else that may make sense!
I have a personal policy of not engaging with people who think they are being clever when they mess around with my pseudonym because it signals to me a deficient intellect and a severe lack of wit but I might make an exception in your case. I’ve seen your comments many times before and to my amazement, I am yet to see anything other then juvenile derision, wisecracks, idiotic “laughing” or sycophantic bootlicking. You really don’t add any value to any threads. Either you know it and don’t care which is quite sad and makes me feel sorry for you, or worse, you actually think you are funny and clever. I have seriously considered using some of your silliness in my “denier comment of the day” series but the criteria for that usually requires the commenter to make a really idiotic statement in an earnest attempt to say something smart. You don’t even reach those lofty heights. Good luck to you. I hope you graduate from grade 4 one day.
😆 Yeah I forgot, BWAAAAAAAAAAHAHAHAHAHAHAHAHA!!!!
Groupie in da house!
Wow, I know I’m right or whatever your handle is. When I re-read the original post by Steven this morning, all I saw was a series of graphs and statements of fact, no arguments, followed by a very weakly worded “conclusion” that basically says that the “record” minimum extent is “probably” irrelevant in the long term. I think he could have omitted the “probably” from his conclusion. It is irrelevant in the long term. There is anecdotal evidence that suggests that the historical ice extent in the Arctic has been far less than 2012 AD’s “record” extent. Logic would dictate that since the Arctic during the MWP (now MCA, which I kinda like because it uses the term “anomaly” which is abused frequently by alarmists) was somewhere around 0.9C warmer than current Arctic temperatures on a multi-decadal basis that there were other things happening in the climate at that time that melted the north polar ice cap to an extent not seen in modern times. So, correctly, Steven has identified that 2012 is irrelevant in the long term. Also, I noted that, ironically, it was an alarmist who made the leap from a graph of increases in multi year Arctic ice to a parallel and relationship (causal or not) between currents and ice. Hmm, I thought it was all atmospheric CO2 content, which was powerful enough to override all other climatic influences.
“Hmm, I thought it was all atmospheric CO2 content, which was powerful enough to override all other climatic influences.”
Well, thankyou for admitting that you bought into that strawman. As for this post, I have what I came for from Steven so, ciao.
An unusual presence of ice for September 23rd, 2012. Hmm, tomorrow,s forecast will surely clear that up!
http://ice-glaces.ec.gc.ca/prods/FICN15CWIS/20120923150000_FICN15CWIS_0006664834.txt
http://ice-glaces.ec.gc.ca/prods/WIS132C/20120923232500_WIS132C_0006665671.gif
Seems like using amo makes the only logical comparison, and only to the last warm mode of say 1945-1955. Anything shorter is a joke scientifically speaking. Of course that makes no sense…forgive me.
Another moron alert
The field of climate science is largely a joke scientifically anyway. (My apologies to the minority of researchers in this field who actually do good work.)
iknowimakenosense
Do you only use this name to post comments? Or, do you post comments here under other names?
Fair go Steve, he actually makes more sense than David Jones, Tim Flannery and Julia Gillard put together.
The average retard in a mental institution can make more sense than those three.
Ah… Ocean memory! You will never be able to get morons to understand this complex fact about the oceans and sea Ice.
http://www.real-science.com/henny-penny-record-arctic-ice#comment-75887
“This has lead to a reduction…” Should “lead” be “led”?
I do. Ed. I was making a joke re uknowispeaksense (albeit a poor one). Am serious about the AMO though. Looking at the record from 1980 to today is a joke. Today should only be compared to the last warm portion of the oceanic cycle. My guess is that since the PDO flipped negative, el nino will no longer step up the antlantic, it hasreached its peak and will soon cool. Pacific already has. Then we can compare 2035 to 1980. What do we compare 2012 to of any meaning? Certainly not 1980, the cold part of the cycle. That WOULD be a joke
I do. Ed. I was making a joke re uknowispeaksense (albeit a poor one). Am serious about the AMO though. Looking at the record from 1980 to today is a joke. Today should only be compared to the last warm portion of the oceanic cycle. My guess is that since the PDO flipped negative, el nino will no longer step up the antlantic, it hasreached its peak and will soon cool. Pacific already has. Then we can compare 2035 to 1980. What do we compare 2012 to of any meaning? Certainly not 1980, the cold part of the cycle. That WOULD be a joke
Barring something else unusual in this arctic melt season, it appears that the National Ice Center (NIC) ice charts have also reached the ice extent minimum for the year. As discussed last month, NIC produces operational ice charts with a different method than the microwave-based Indices that are exclusively reported in the media.
As of Sept. 21, 2012, NIC reports the minimum (so far):
8/10ths 3,275,795 sq. Km.
Marginal zone 923,871 sq. Km.
Ice Extent 4,199,666 sq. Km.
For comparison, NIC reports the 2007 minimum on Sept. 11, 2007:
8/10ths 3,547,333 sq. Km.
Marginal zone 1,018,054 sq. Km.
Ice Extent 4,565,387 sq. Km.
Whether comparing the pack ice (>80%) or the total extent including the marginal zone (10% to 80% concentration), 2012 is reported as ~8% less than 2007, or a reduction in arctic ice extent of 365,721 sq. Miles.
Considering that 2012 started with a higher maximum in March than 2007 did (15.97 M. sq. Km. Vs. 15.81 M. sq. Km.), it truly is a remarkable single melt season this year. There was warm water from the Atlantic, a rare late summer cyclone and persistent air temperature near freezing, only now dropping towards normal for the time of year. Release of heat from more open water probably contributed to the latter effect. Still, the numbers say that a lot of ice remains in the Arctic, and it is not wise to extrapolate from one season to an ice-free arctic.
What remains is to see what effect this event may have on weather patterns, and what kind of recovery will be seen in the months ahead.
For those who want to know more about NIC ice charts:
“Arctic charts include information on sea ice concentration and edge position as well as (since about 1995)information on ice type. The charts are constructed by analysts using available in situ, remotely sensed, and model data sources. Data sources and methods of chart construction have evolved since 1972 resulting in inconsistencies in the data record; a
characteristic shared with most operational products. However the arctic-wide charts are the product of manual interpretation and data fusion, informed by the analyst’s expertise and by ancillary products such as climatologies and ice information shared by foreign operational ice services. They are therefore often more accurate, especially since the addition of synthetic aperture radar to data sources in the mid 1990s, than are the passive microwave derived sea ice data sets commonly used by researchers. This is especially true for ice edge location because of its operational importance. NIC provides charts free of charge on their Web site.”
“Often a wide marginal ice zone of 40% to 60% is not detected in passive microwave (this was noted anecdotally in earlier studies by the authors comparing passive microwave with ice chart and other analyses), and this appears to be the case here. Also, the NIC partial ice concentration for multiyear shows that thinner types are present in higher concentration near the edge, and passive microwave can fail to detect thinner, younger ice.”
ftp://sidads.colorado.edu/pub/ppp/conf_ppp/Fetterer/National_Ice_Center_Arctic_sea_ice_charts_and_climatologies_in_gridded_and_GIS_format.pdf
NIC charts are available here: http://www.natice.noaa.gov/products/products_on_demand.html
Correction: It should read 365,721 sq.km.difference between 2012 and 2007.
Well that proves “it’
The problem with the CO2 causes Arctic melt claim is that it contradicts observations and data. If it’s a factor, it may a minor one relative to natural variability which is high in this region.
“Understanding Arctic temperature variability is essential for assessing possible future melting of the Greenland ice sheet, Arctic sea ice and Arctic permafrost. Temperature trend reversals in 1940 and 1970 separate two Arctic warming periods (1910–1940 and 1970–2008) by a significant 1940–1970 cooling period. Analyzing temperature records of the Arctic meteorological stations we find that (a) the Arctic amplification (ratio of the Arctic to global temperature trends) is not a constant but varies in time on a multi-decadal time scale, (b) the Arctic warming from 1910–1940 proceeded at a significantly faster rate than the current 1970–2008 warming, and (c) the Arctic temperature changes are highly correlated with the Atlantic Multi-decadal Oscillation (AMO) suggesting the Atlantic Ocean thermohaline circulation is linked to the Arctic temperature variability on a multi-decadal time scale.”
http://www.agu.org/pubs/crossref/2009/2009GL038777.shtml
And does the ice on the top of the globe suppose to indicate how much the planet has warmed?
If so what does the advance in ice on the other pole indicate?
The weighted average sea levels plus atmospheric conditions would be a better indicator.
Fascinating.
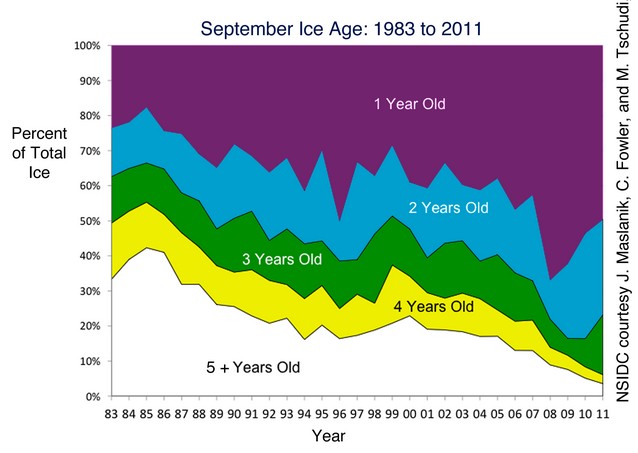
According to the last chart, of the total *decreasing* amount of ice, the older 5-year and 4-year ice are steadily *decreasing*. That, and the steady increase in 1-year ice is a strong indication of overall melting trend. Did you say that, or am I missing something?
You are missing basic math skills. After the 2007 minimum, it takes five years for new five year old ice to appear.
You’re wrong. To read that chart, first read both captions, then follow each colored patch separately from left to right. There is no math.
Little boy, let me help you with your math.
After your first year, you are one year old – so you get one candle on your cake After your second year, you are two years old – so you get two candles on your cake ……..
For our alarmist friends benefit here is a little true Greenland history about a P38 Lighting forced down near the South East coast of Greenland on July 15, 1942.
http://en.wikipedia.org/wiki/Glacier_Girl
http://p38assn.org/glaciergirl/history.htm
“On 15 July 1942, due to poor weather and limited visibility, Glacier Girl’s squadron was forced to make an emergency landing in Greenland en route to the British Isles during Operation Bolero. All crew members were subsequently rescued. However, Glacier Girl, along with the unit’s five other P-38 fighters and two B-17 bombers, was eventually buried beneath 260 feet of ice due to decades of blowing snow and drifting glaciers. Fifty years later, in 1992, the plane was brought to the surface by members of the Greenland Expedition Society after years of searching and excavation.”
Can the Alarmist at least admit that there’s a whole lot of ice in “Greenland?” In only 50 years Glacier Girl and her sister aircraft were entombed under a NEW layer of Greenland fresh water glacial ice to the tune of more than 25 stories deep.
Here is a Gold Star moment for our alarmist friends brought to you by the US Army Air Force. Approximately 1,000 years earlier Vikings had colonized the Greenland coast south of where Glacier Girl came to rest. This colonization was during the so called “Medieval Warm Period.” What happened?
1. Did Nero burn so many Christians in Rome that the CO2 hockey stick gas he created got out of hand and melted the Arctic?
2. Did the citizens of Pompeii anger the Volcano God Vesuvius by tickling him with their plows? Then to get even did he not only obliterated Pompeii but also defrosted Greenland in the bargain?
3. Your home work assignment it is to tell us how much more new fresh water ice would have accumulated over Glacier Girl if she had not been pulled out of the deepfreeze in 1992 or 22 years ago. The first boy or girl with the right answer gets a gold star.