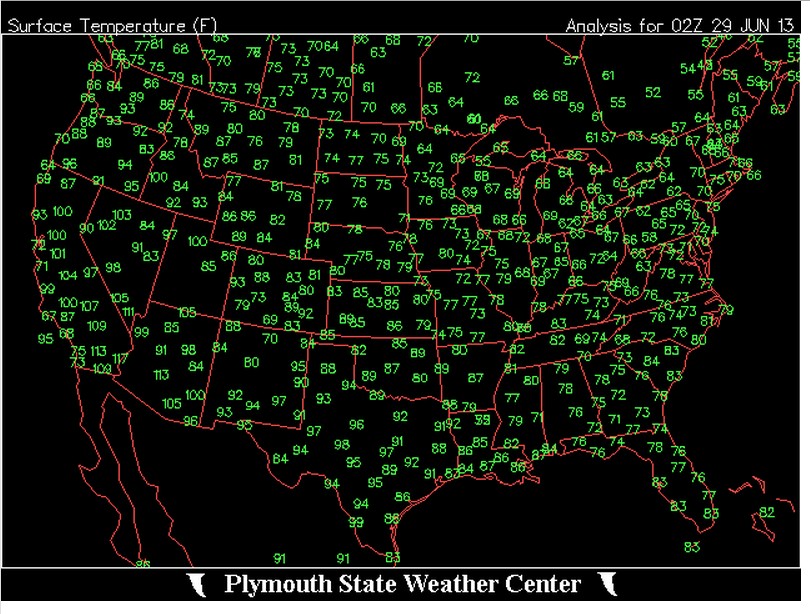
Freak heat means a typical end of June day in the southwest
Disrupting the Borg is expensive and time consuming!
Google Search
-
Recent Posts
- Fact Checking NASA
- Fact Checking Grok
- Fact Checking The New York Times
- New Visitech Features
- Ice-Free Arctic By 2014
- Debt-Free US Treasury Forecast
- Analyzing Big City Crime (Part 2)
- Analyzing Big City Crime
- UK Migration Caused By Global Warming
- Climate Attribution In Greece
- “Brown: ’50 days to save world'”
- The Catastrophic Influence of Bovine Methane Emissions on Extraterrestrial Climate Patterns
- Posting On X
- Seventeen Years Of Fun
- The Importance Of Good Tools
- Temperature Shifts At Blue Hill, MA
- CO2²
- Time Of Observation Bias
- Climate Scamming For Profit
- Climate Scamming For Profit
- Back To The Future
- “records going back to 1961”
- Analyzing Rainfall At Asheville
- Historical Weather Analysis With Visitech
- “American Summers Are Starting to Feel Like Winter”
Recent Comments
- arn on Fact Checking NASA
- Gordon Vigurs on Fact Checking NASA
- Bob G on Fact Checking NASA
- Bob G on Fact Checking NASA
- arn on Fact Checking NASA
- conrad ziefle on Fact Checking NASA
- conrad ziefle on Fact Checking NASA
- arn on Fact Checking NASA
- Bob G on Fact Checking NASA
- Bob G on Fact Checking NASA


do you have the anomaly data?
No but I have lived most of my life in NM, CO, AZ, TX and CA and these are typical temperatures for this time of year.
Woah.. look at all those numbers.. I’m freaked out!
“Freak heat means a typical end of June day in the southwest”
Concur. I can’t say how many times I’ve been in the Southwest this time of year and experienced these temps as a matter of course. It’s the desert. In summer. It’s supposed to be hot. I haven’t seen any of the AGW zealots explain what ‘normal’ temperatures are supposed to be.
Me neither, but I reckon they expect to wake up to glorious sunshine, 25C every day.
I read somewhere that there should be a chart depicting at what weather/climate events the alarmists come out of the woodwork. That’s easy – any temp chart. It goes up 0.1C, they become more shrill. Pretty simple and until they conceded the “pause” and started to make excuses such as “warming = cooling”, about 97% accurate.
It’s fun watching them flail.
Ketlle Falls WA seems to be pretty hot. Or could by any chance 129 degrees be a mistake?
http://www.wrh.noaa.gov/mesowest/getobext.php?wfo=otx&sid=KTLW1&num=72&raw=0