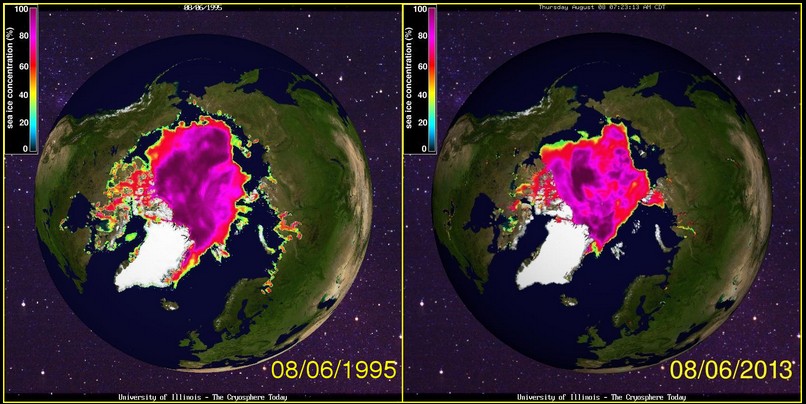
It is terrifying to see that there is just as much ice as there was 18 years ago.
Disrupting the Borg is expensive and time consuming!
Google Search
-
Recent Posts
- Gaslighting 1924
- “Why Do You Resist?”
- Climate Attribution Model
- Fact Checking NASA
- Fact Checking Grok
- Fact Checking The New York Times
- New Visitech Features
- Ice-Free Arctic By 2014
- Debt-Free US Treasury Forecast
- Analyzing Big City Crime (Part 2)
- Analyzing Big City Crime
- UK Migration Caused By Global Warming
- Climate Attribution In Greece
- “Brown: ’50 days to save world'”
- The Catastrophic Influence of Bovine Methane Emissions on Extraterrestrial Climate Patterns
- Posting On X
- Seventeen Years Of Fun
- The Importance Of Good Tools
- Temperature Shifts At Blue Hill, MA
- CO2²
- Time Of Observation Bias
- Climate Scamming For Profit
- Climate Scamming For Profit
- Back To The Future
- “records going back to 1961”
Recent Comments
- conrad ziefle on Gaslighting 1924
- arn on Gaslighting 1924
- Gordon Vigurs on Gaslighting 1924
- Bob G on Climate Attribution Model
- conrad ziefle on Climate Attribution Model
- Ohio Cyclist on Climate Attribution Model
- Bob G on Climate Attribution Model
- Bob G on Climate Attribution Model
- Bob G on Fact Checking NASA
- arn on Climate Attribution Model


The alarmist “scientists” said it will all disappear in 4 weeks time.
How could we not believe them? Their science is unbiased. Just because they get millions in grants, doesn’t mean they would lie. Or does it?
Yup, it’ll be gone in four weeks. That is part of Last First’s secret plan…
Half the people would say, “All Hail”, the other half, “Aw, Hell”…
I still want to know why that Russian Ice Breaker was at the North Pole on August 30th breaking up ice that does not refreeze in summer.
50 Let Pobedy? *July* 30th. It goes there every summer within a day or two of that date (since it was built in 2007). I don’t know why.
It went straight there (NP) and straight back, so it’s not like it was doing loads of icebreaking. I’ve seen (in historic position reports)(Greenpeace icebreaker) Arctic Sunrise trolling backwards and forwards between Greenland and Iceland, looking (to me) as if it was trying
(and failing) to break up the ice. That was a couple of years ago. They’re up at Kirkenes, N. Norway now, and may try the NE passage.
(One to watch. 😉
“Rich Tourists.” https://www.youtube.com/watch?feature=player_embedded&v=Q6OHHGrVM3g
It’s even more terrifying when one compares 2013 with 2012 or 2007 for early August (warning: this isn’t recommended for people with heart conditions).
um…. I agree with you 99.99999% of the time, and there’s plenty of ice, but when I look closely, it looks like there is a bit less. unless it’s an optical illusion (looking at the extent of the edges). is it possible to get a rough measure of the coverage area?