In 1974, the consensus was near certain death, starvation and anarchy due to global cooling, while others argued that sea level would soon rise dangerously.
Lakeland Ledger – Dec 29, 1974
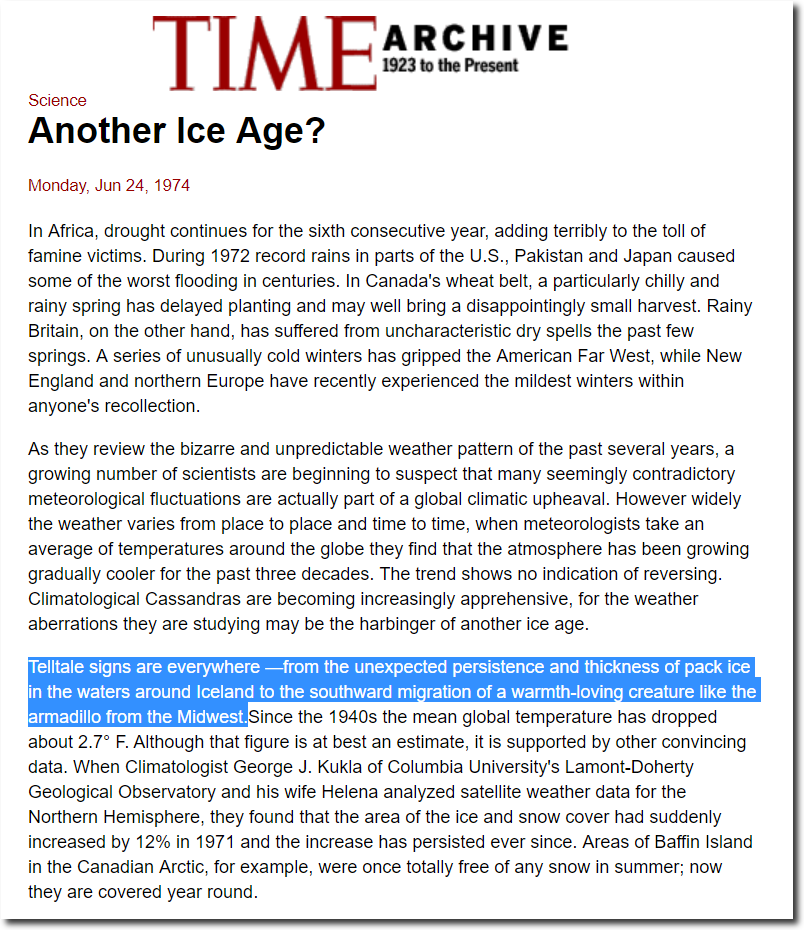
“Bryson and a group of fellow climatologists met last summer in Bonn under the auspices of a group called the International Federation of Institutes for Advanced Study and issued a statement that startled many of their colleagues. It read, in part: “The facts of present climate change are such that the most optimistic experts would assign near certainty to major crop failures within a decade. If national and international policies do not take these near-certain failures into account, they will result in mass deaths by starvation and probably in anarchy and violence that could exact a still more terrible toll … We are aware of differences among experts as to the cause-and-effect relationships of observed climatic facts and, consequently, as to the most likely prognosis. Professionally, the differences are important, but they do not—and should not be allowed to—obscure the larger consensus that the observed changes are neither trivial nor ephemeral.”
The Bonn statement caused an uproar, and its strong wording was subsequently softened; a number of climatologists and meteorologists also took issue with the “consensus” it described. Prof. Mikhail Budyko of the Soviet Hydrometeorological Service, for one, discounts the significance of the recent cooling trend and warns that over a longer term the climate has actually been getting warmer because of human activities, particularly the burning of fossil fuels, and that the sea level will soon rise dangerously as the Antarctic and other ice caps melt.”

Lakeland Ledger – Google News Archive Search
Fifty years later, academics are just starting to get past the Antarctic melting scam.
“during most of the LIG, the Ronne Ice Shelf was still in place, and close to its current extent. Water isotope data are consistent with a retreat of WAIS9, but seem inconsistent with more dramatic model realizations10 in which both WAIS and the large Antarctic ice shelves were lost. This new constraint calls for a reappraisal of other elements of the LIG sea-level budget. It also weakens the observational basis that motivated model simulations projecting the highest end of projections for future rates of sea-level rise to 2300 and beyond.”

The Ronne Ice Shelf survived the last interglacial | Nature