
According to the press, New Zealand is experiencing record heat, with their hottest day only 7C cooler than 50 years ago during the ice age scare.

2023 declared New Zealand’s second hottest year | Stuff.co.nz
According to the press, New Zealand is experiencing record heat, with their hottest day only 7C cooler than 50 years ago during the ice age scare.
2023 declared New Zealand’s second hottest year | Stuff.co.nz
Someone sitting at a desk at NOAA has determined that a rural station at Bouar in the Central African Republic, needs to have its data altered to turn a flat trend into six degrees of warming.


In 1984, NASA’s James Hansen predicted 8C warming in Antarctica due to increased CO2. There has been no warming in Antarctica since then.


RSS_TS_channel_TLT_Southern Polar_Land_and_Sea_v03_3.png (440×240)
NOAA predicted a warm January-March for the US

Climate Prediction Center – Seasonal Outlook
And this is what we are getting.

Like other climate activists, a small handful of people at NASA and NOAA have decided they have the right to destroy work done by much greater people in the past,
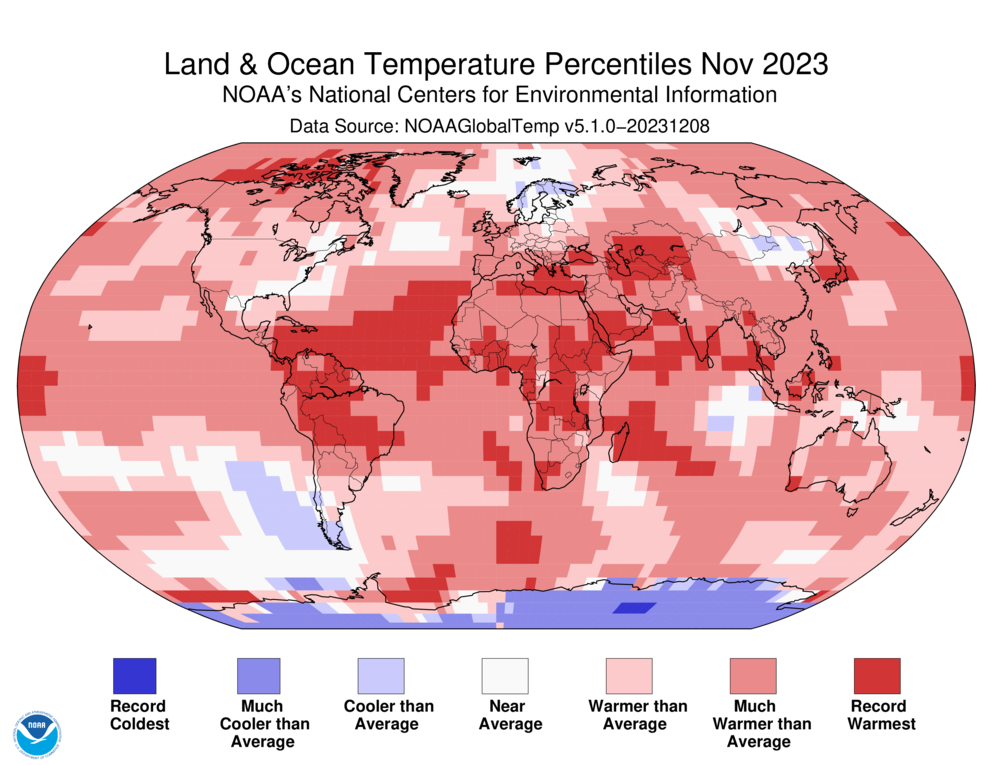
The DRC is three times the size of Texas. NOAA often reports record heat there despite not having any actual data.

map-percentile-mntp-202311.png (990×765)

There is no recent data in the DRC outside of NDJILI_INTL, which is one of the largest Urban Heat Islands
![]()
![]()
If the airport is removed, the trend disappears
![]()


A short look at the junk science and fraud behind the making of the “global temperature record.”
NOAA claims they reduce the UHI effect at Buenos Aires in their final adjusted database, but they don’t – they actually increase it

Data.GISS: GISS Surface Temperature Analysis (v4)C

https://www.ncei.noaa.gov/pub/data/ghcn/v4/ghcnm.tavg.latest.qcu.tar.gz

https://www.ncei.noaa.gov/pub/data/ghcn/v4/ghcnm.tavg.latest.qcf.tar.gz
The GHCN database has very few stations from South America, with five of them near Buenos Aires


Data.GISS: GISS Surface Temperature Analysis (v4): Station Data
The UHI contaminated Buenos Aires thermometer gets homogenized into the other stations and triples the warming trend.


Five different groups came up with very similar graphs based on the same set of non-existent temperature data.


