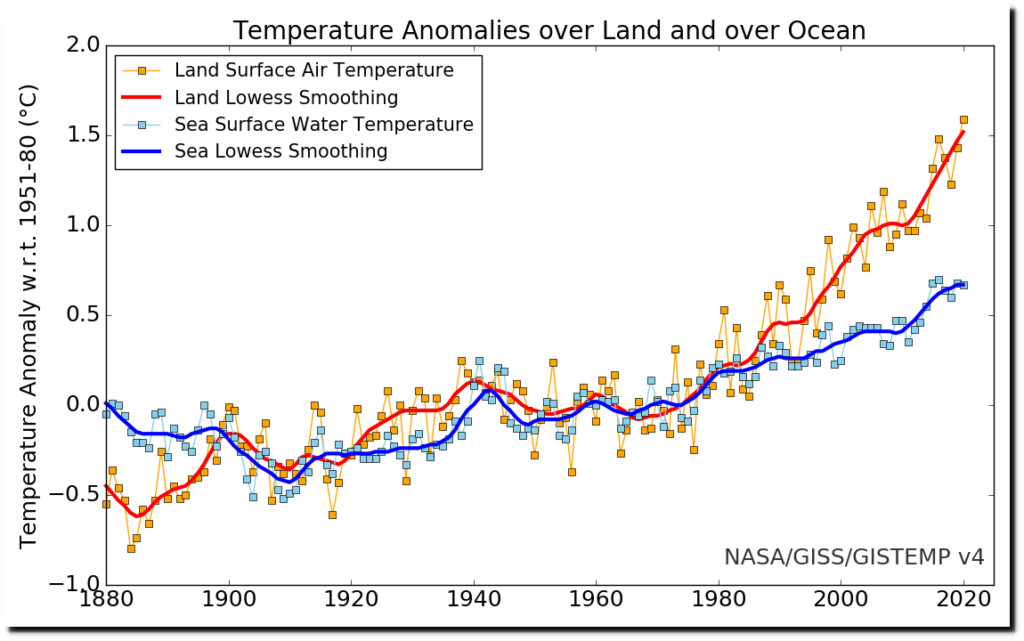
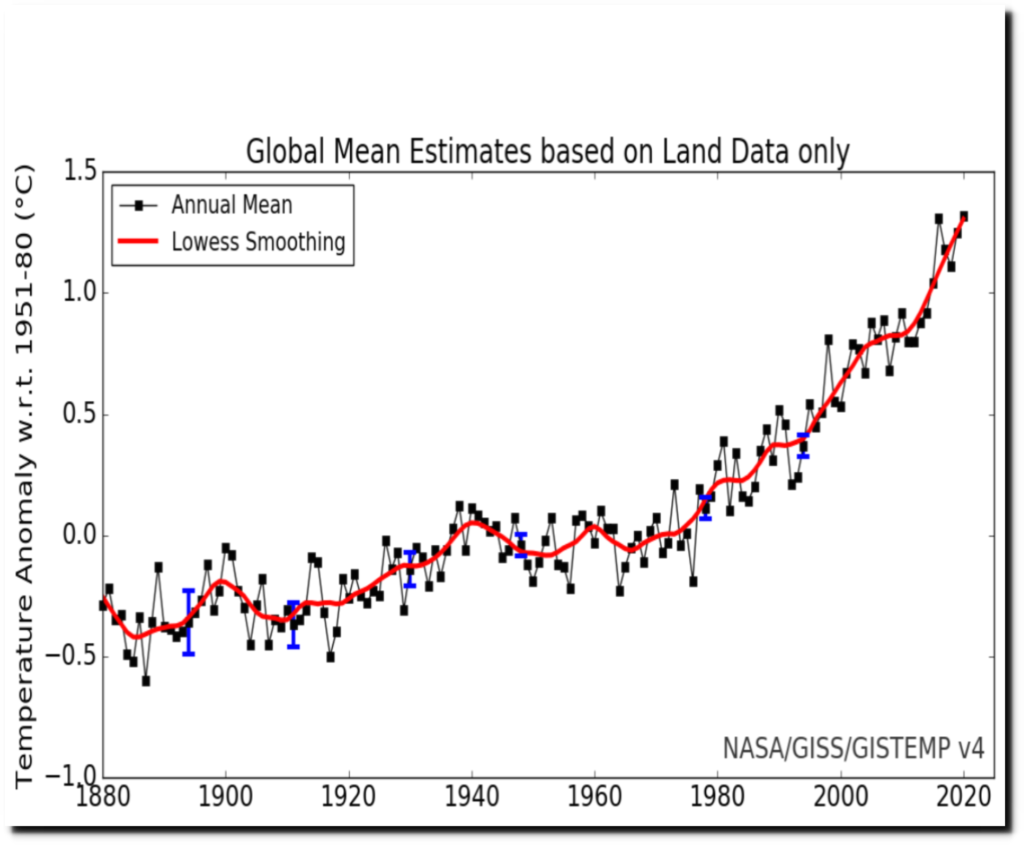
NASA GISS v4 shows more than 2C warming over land since 1880.
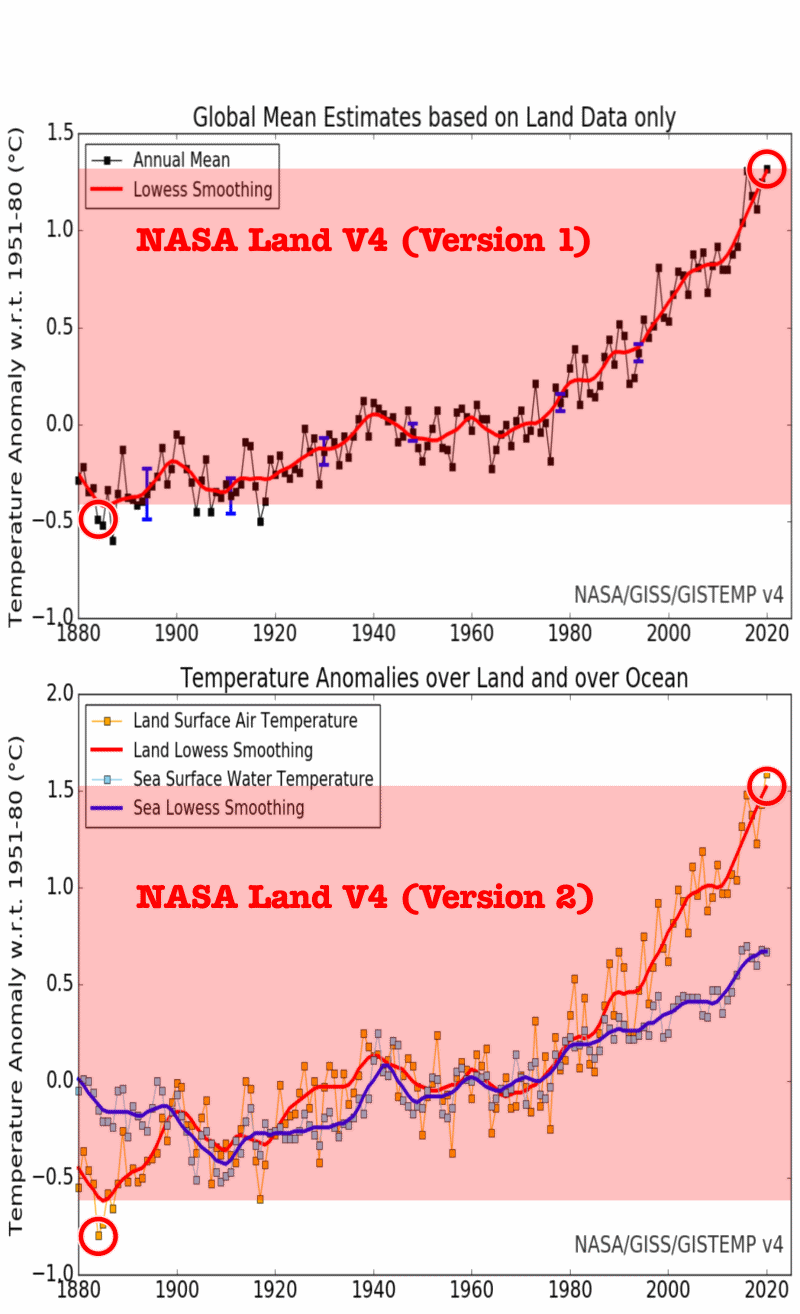
A different version of the same V4 graph also shows about 1.6C warming over land since 1880. This graph used to be linked to from their website, but I can no longer find any links. However the graph is still present on their website.
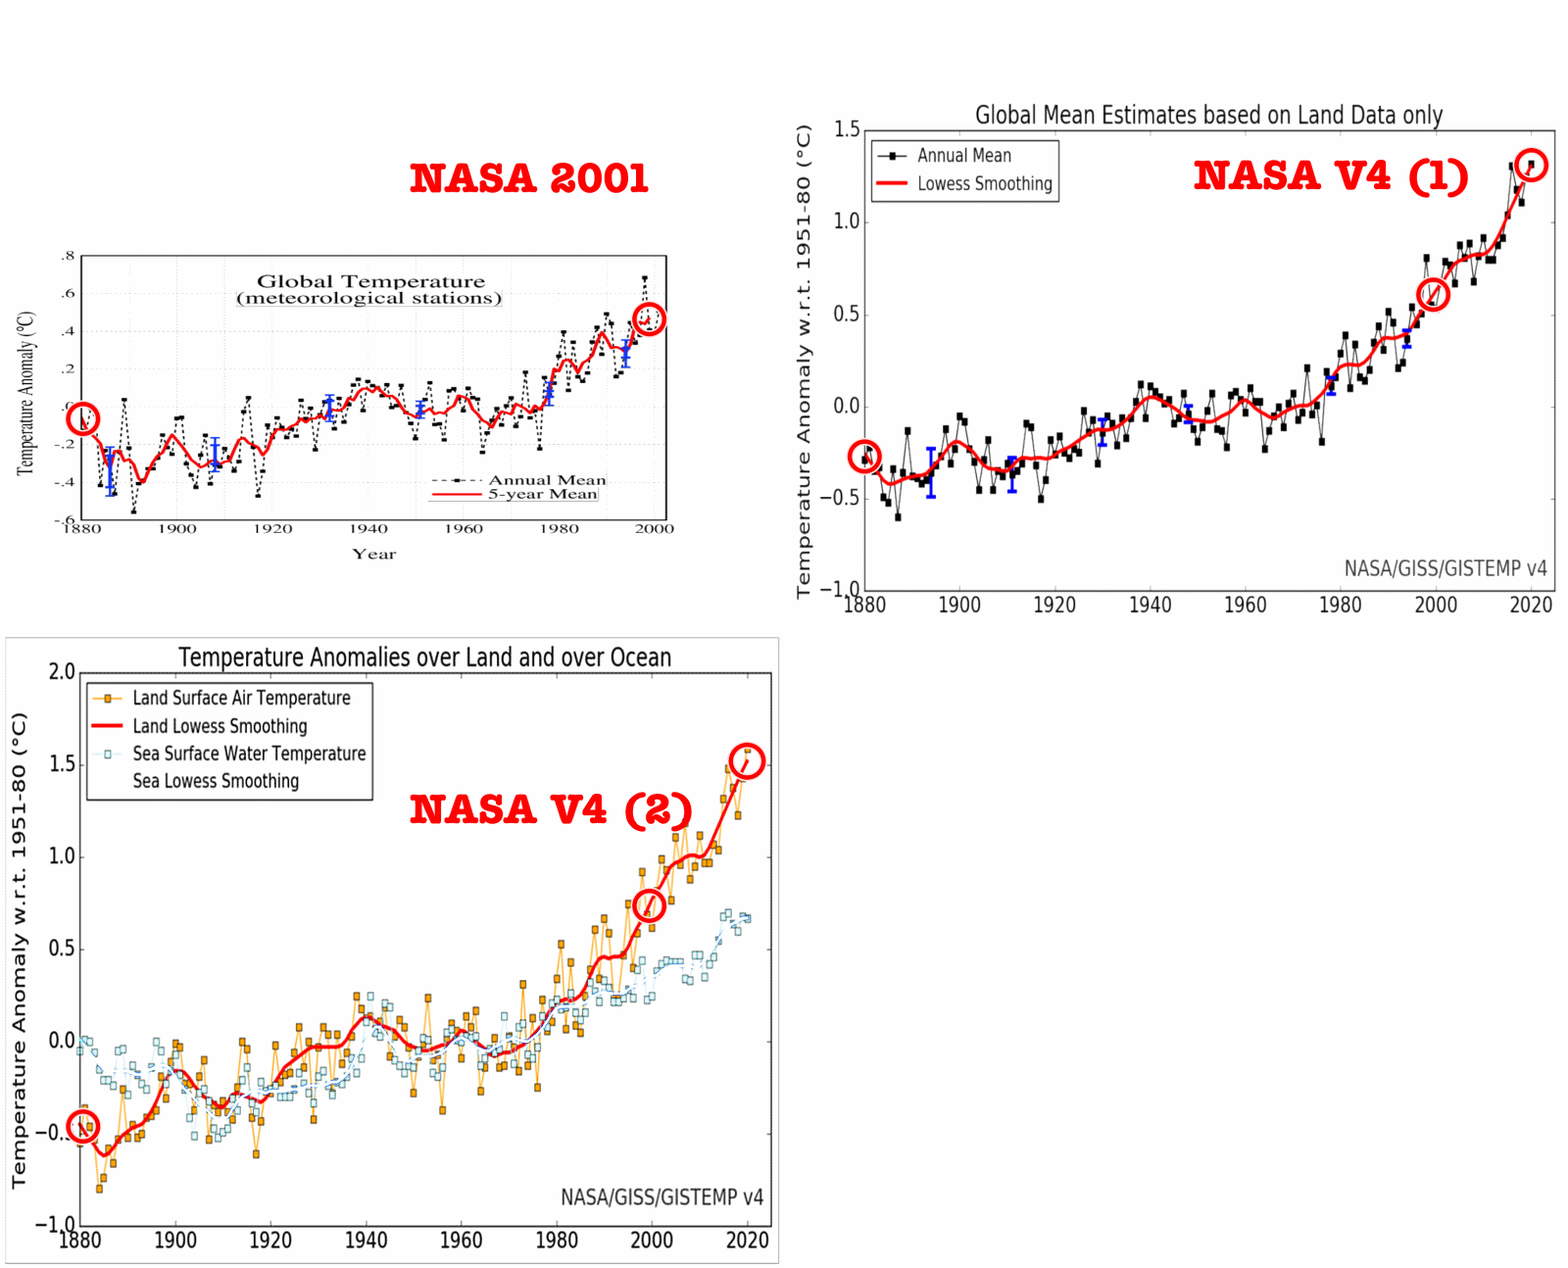
The red lines in both of the graphs above should be identical, but they aren’t. Here is an animation showing how they are altering the land data in the new graph vs. the old graph. They have increased recent temperatures by about 0.3C and cooled past temperatures by about the same amount.
2001: Fig.A.ps
The person in charge at NASA (Gavin Schmidt) has me blocked on Twitter, but Tom Nelson questioned him about this change. This is how he responded.
He does tweet in a colorful mask however.
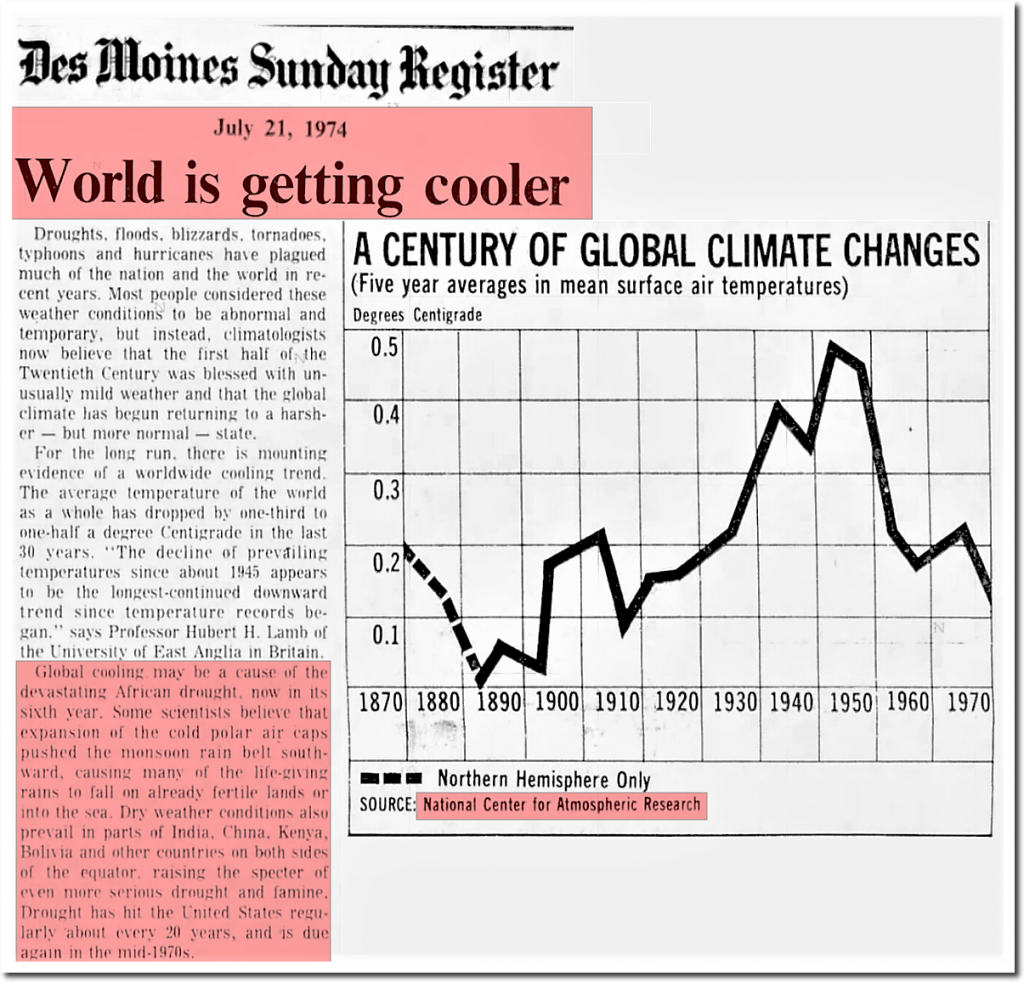
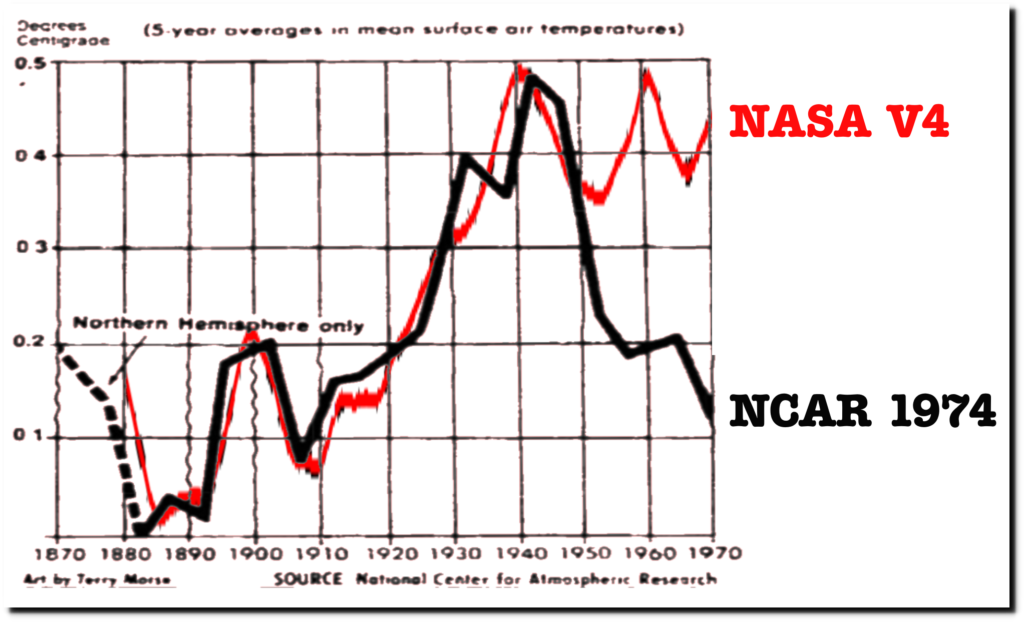
But the data tampering story gets much worse. In 1974, the National Center for Atmospheric Research showed no net warming from 1870 to 1970, with the warmest decade being the 1940s, followed by a sharp cooling.
21 Jul 1974, 13 – The Des Moines Register at Newspapers.com
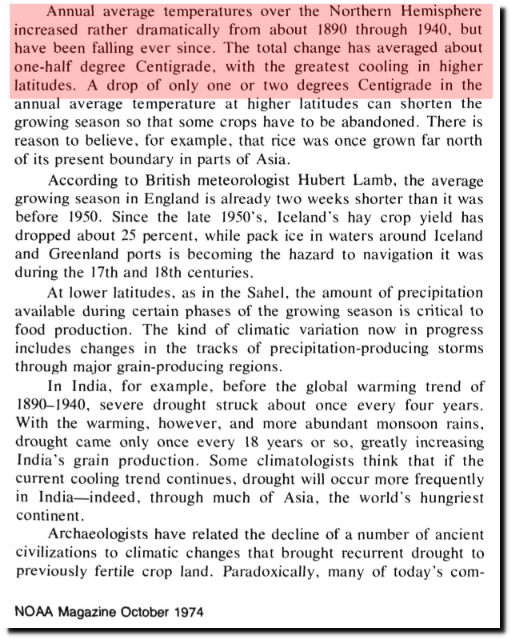
This cooling was confirmed in NOAA Magazine October, 1974
In 1978, the New York Times confirmed the cooling trend was continuing.
But NASA has since erased the post-1940 cooling.
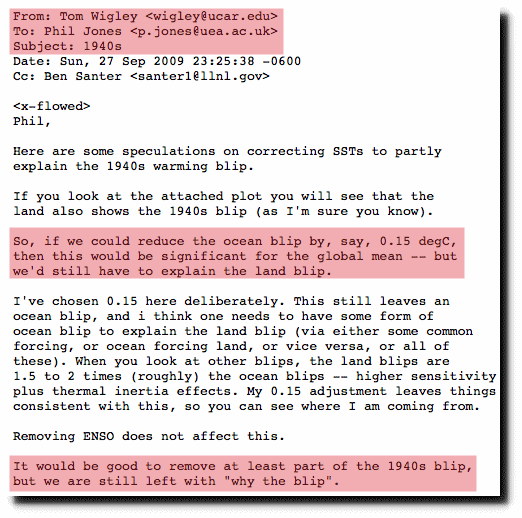
In this Climategate email, climate scientists from different agencies discussed their desire to remove the 1940s warmth.
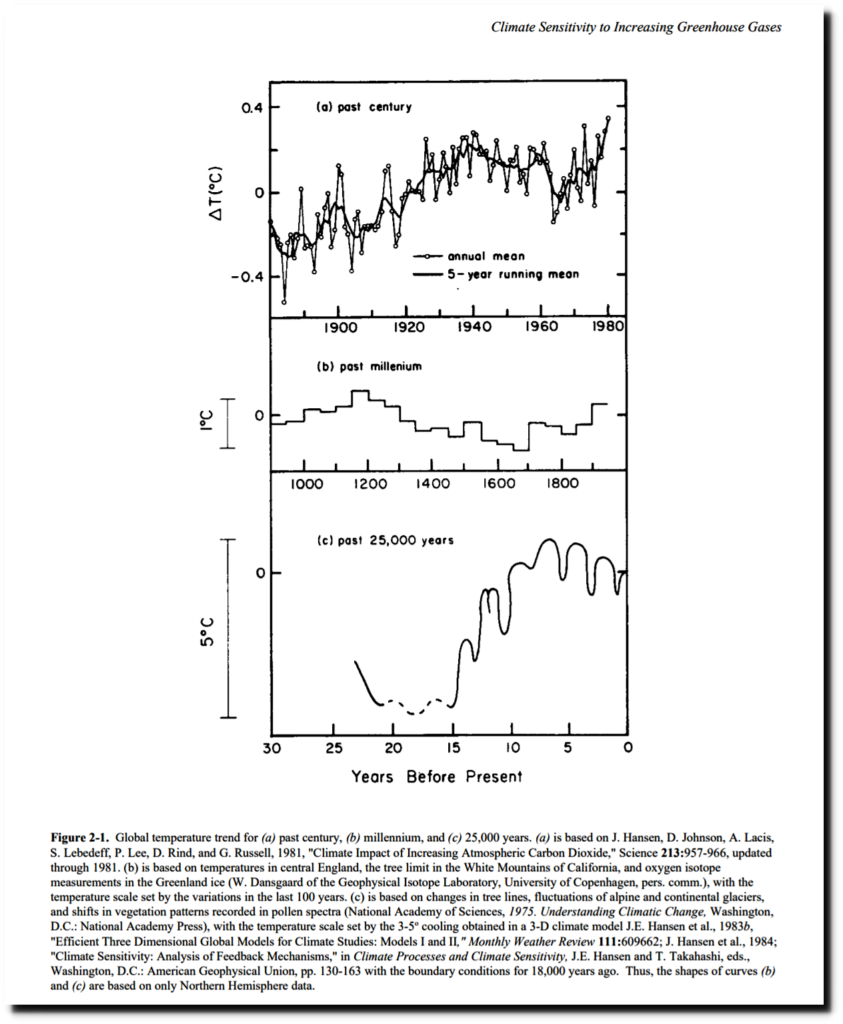
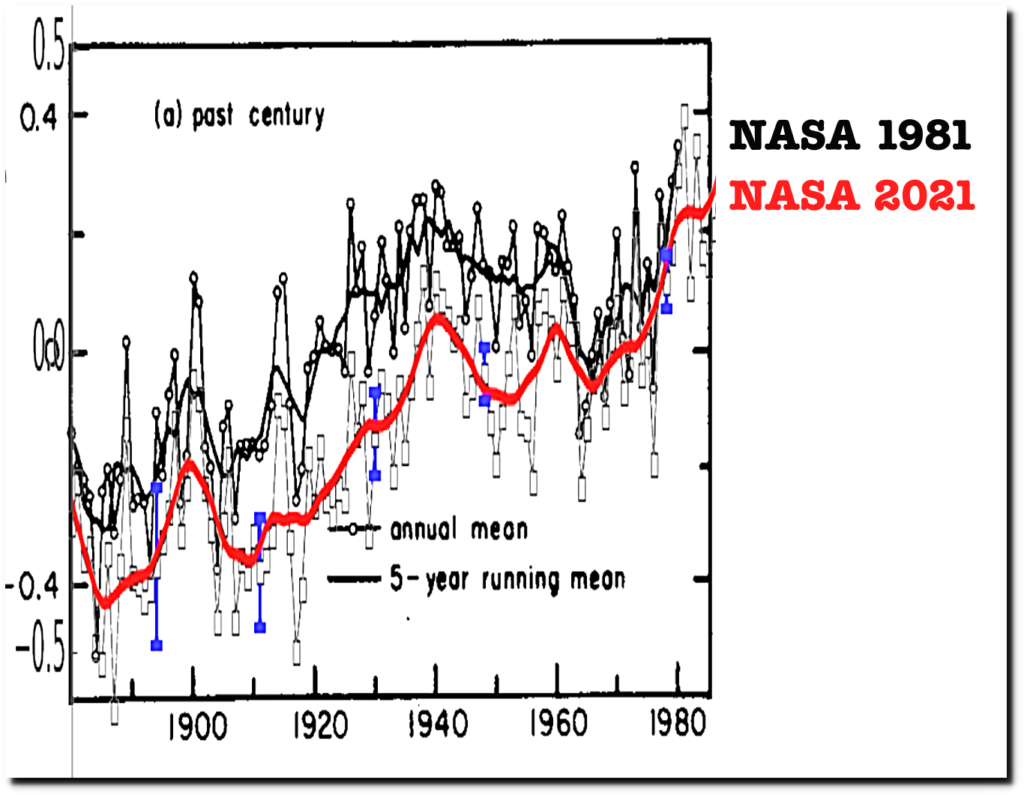
In 1981, NASA did show a 1940s blip followed by 0.3C cooling. They also showed a Medieval Warm Period and a Holocene Optimum.
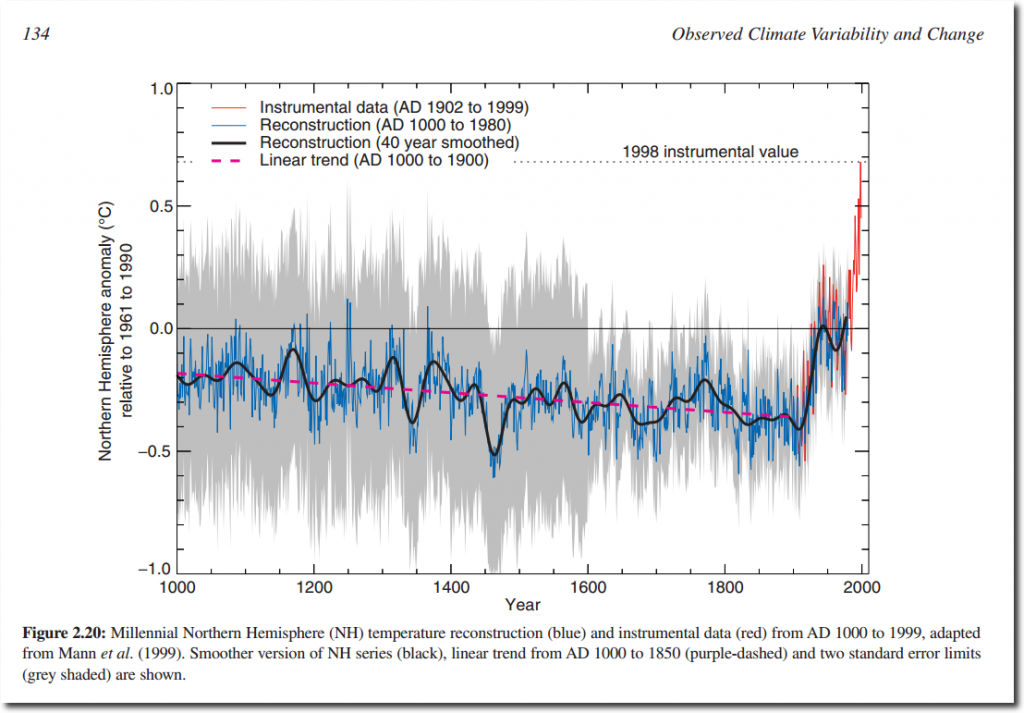
Michael Mann later erased the Medieval Warm Period.
And the post 1940s cooling has since been erased by NASA.
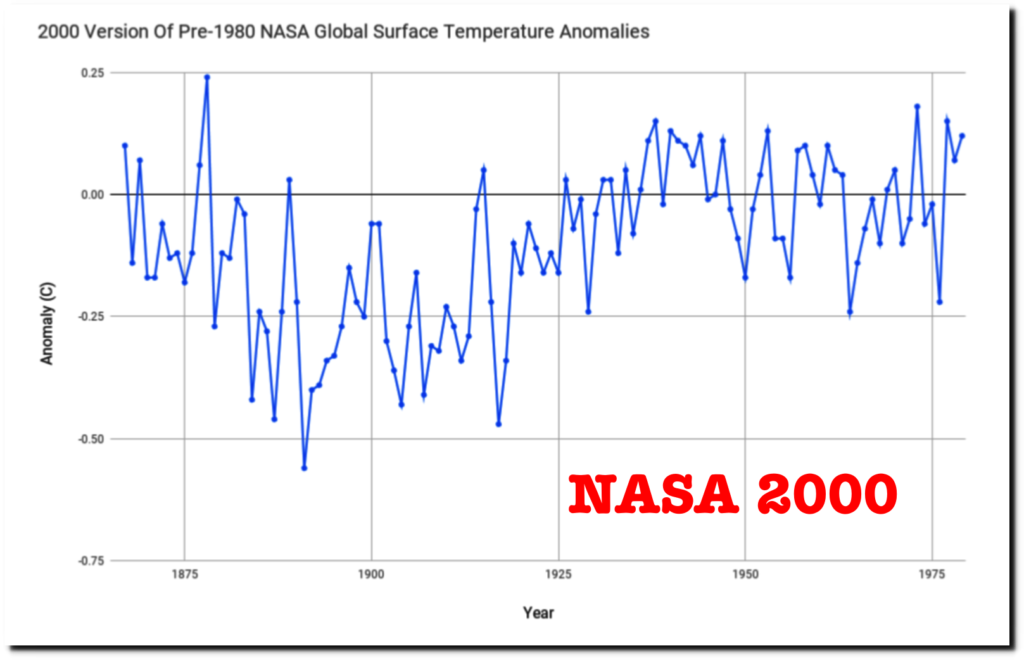
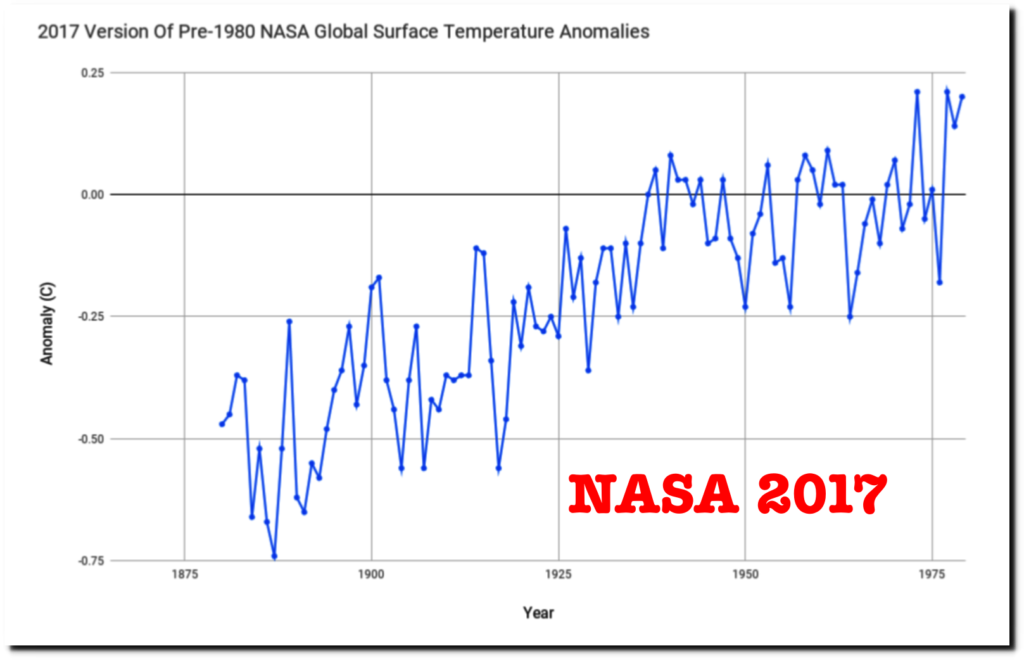
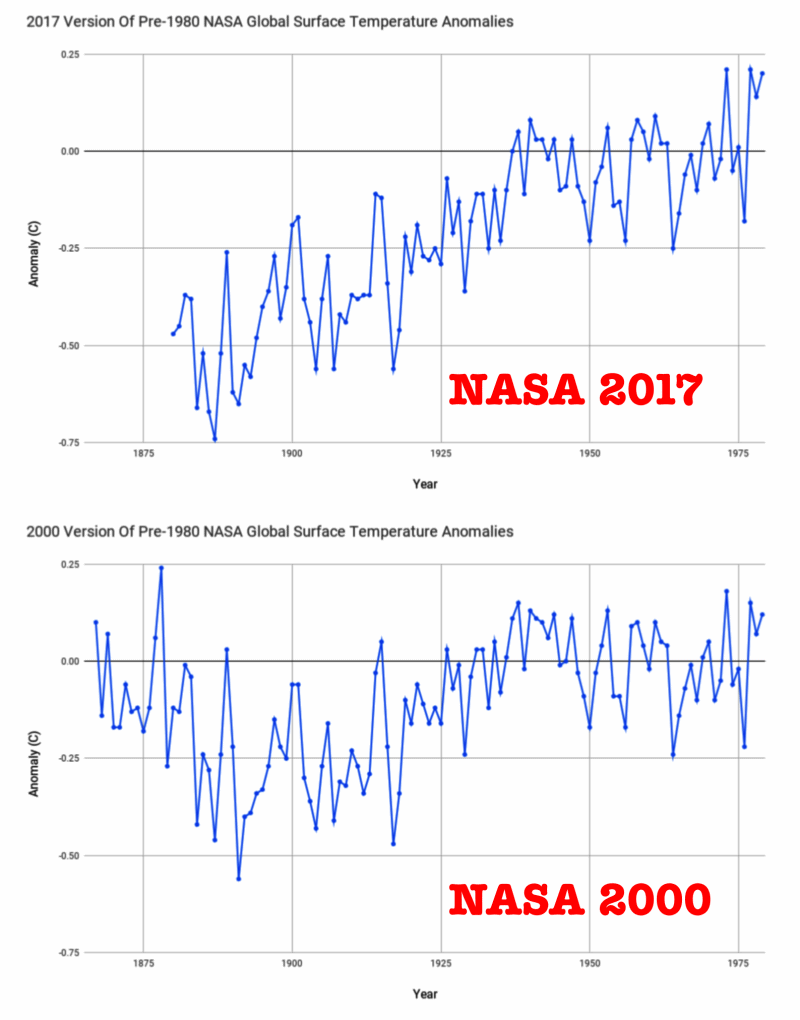
As of the year 2000, NASA showed no net warming from 1870 to 1979, with 1878 being the warmest year.
But they now hide data before 1880, and show about 0.7C warming prior to 1980
https://data.giss.nasa.gov/gistemp/history/output/met_used.zip
This animation shows how they have altered the data
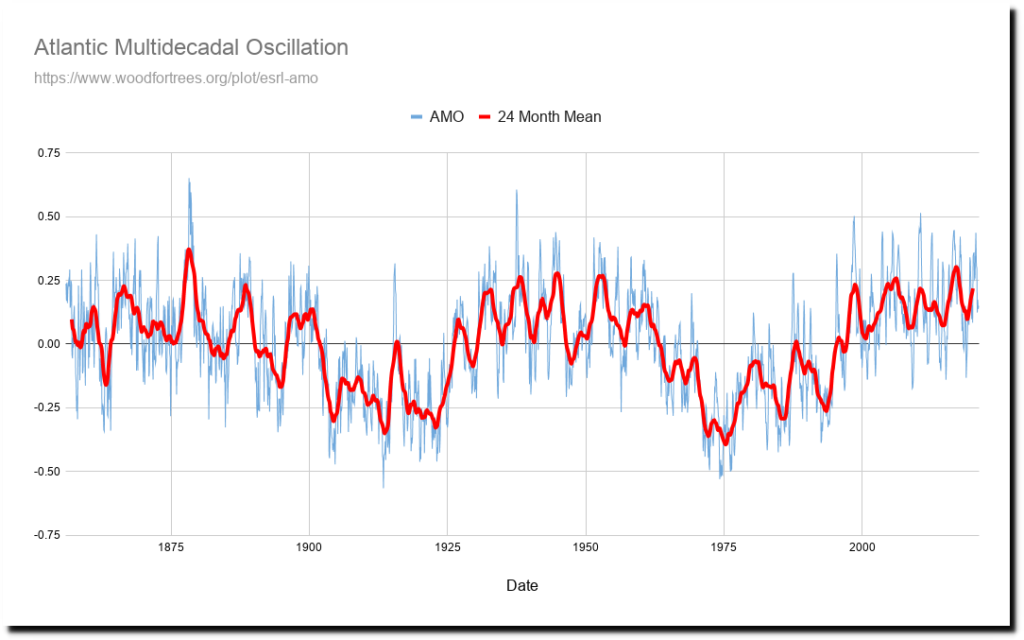
The 1878 warmth is important because the Atlantic Multidecadal Oscillation peaked in 1878, and produced record warmth and global drought.
Wood for Trees: Interactive Graphs
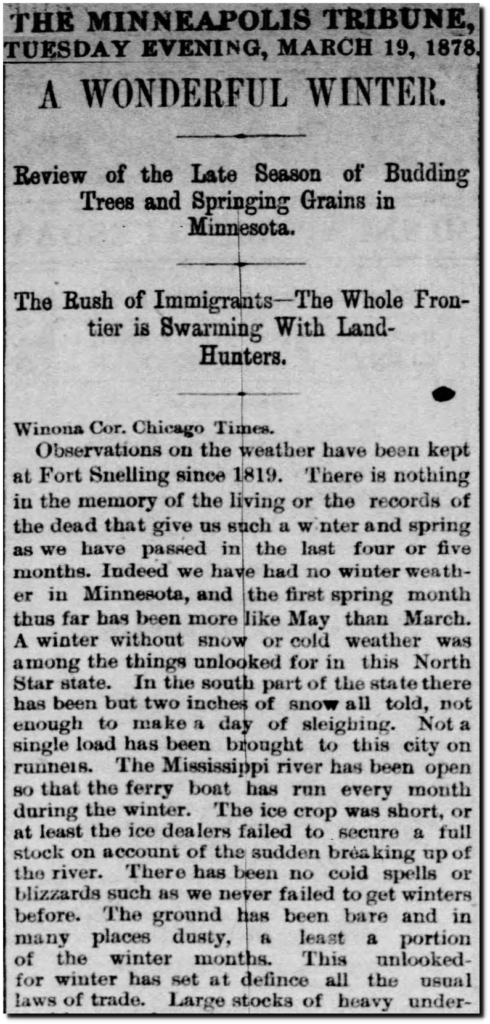
There was no winter in Minnesota that year.
19 Mar 1878, Page 2 – Star Tribune at Newspapers.com
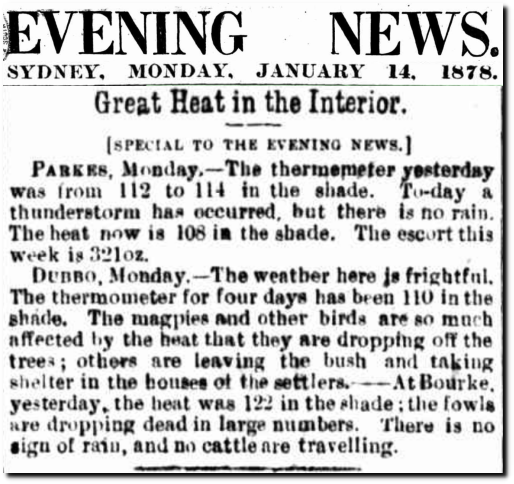
Australia had record heat.
14 Jan 1878 – Great Heat in the Interior. – Trove
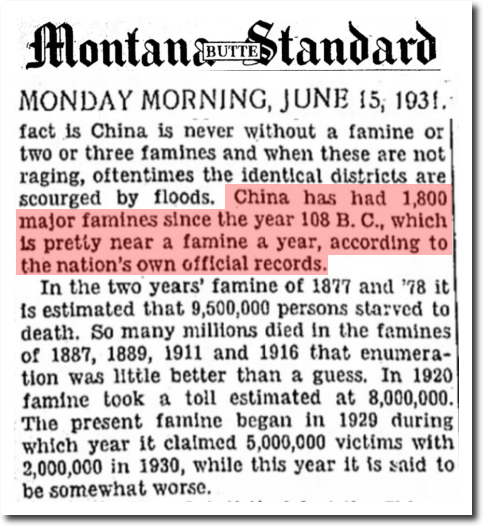
China had a famine which killed nearly ten million people.
15 Jun 1931, Page 6 – Montana Butte Standard at Newspapers.com
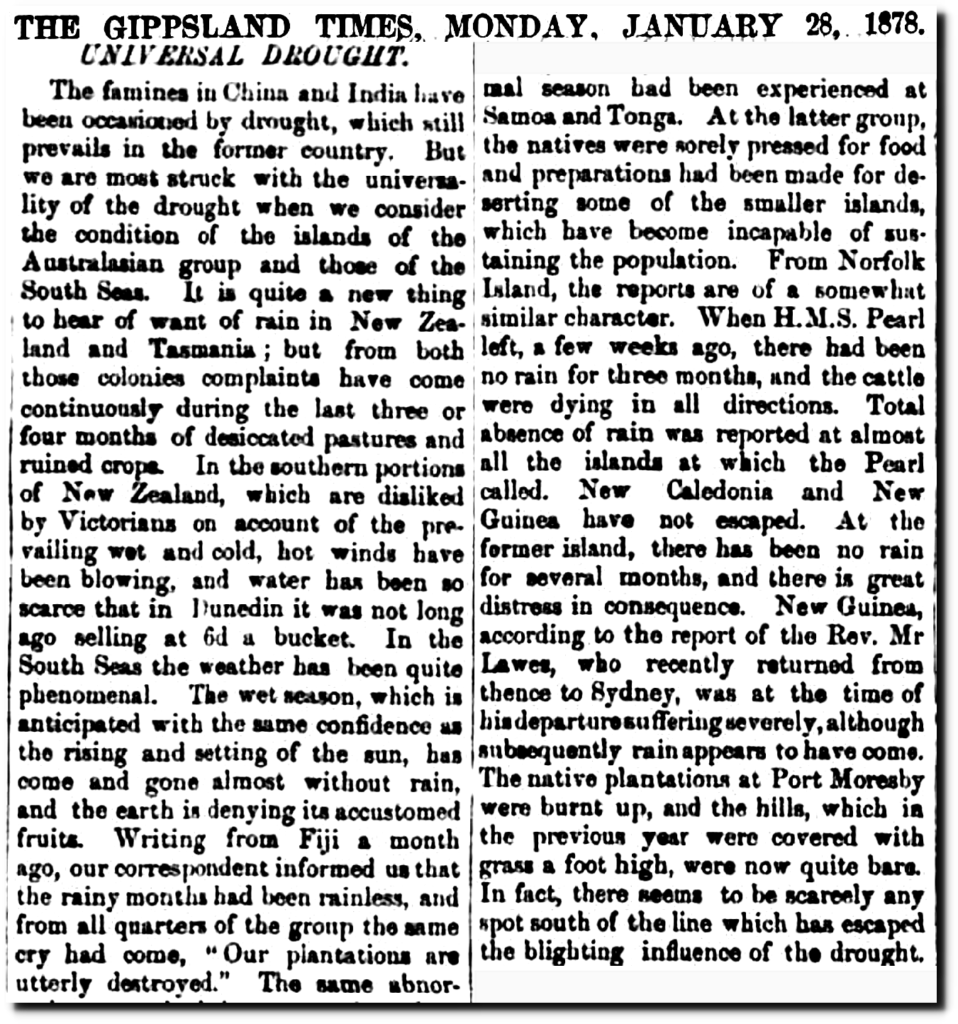
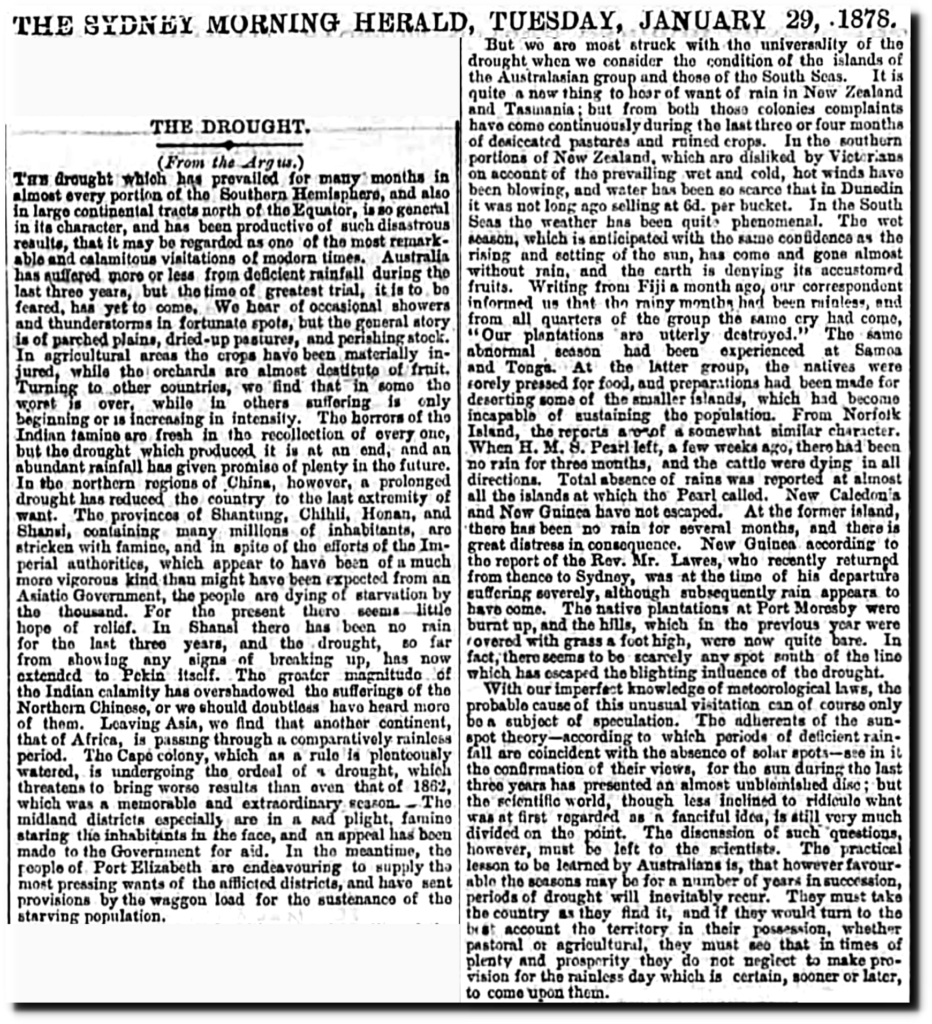
And there was universal drought.
28 Jan 1878 – UNIVERSAL DROUGHT. – Trove
29 Jan 1878, Page 7 – The Sydney Morning Herald at Newspapers.com
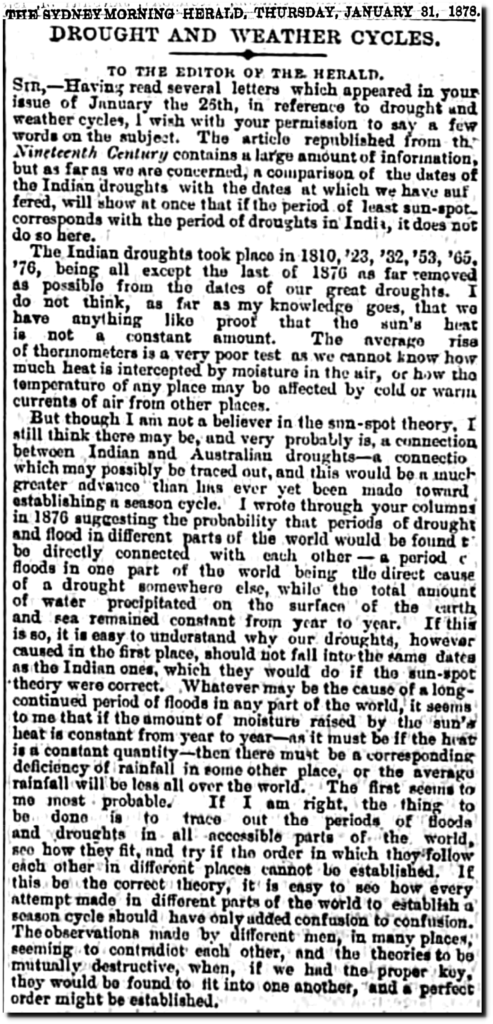
31 Jan 1878, Page 7 – The Sydney Morning Herald at Newspapers.com
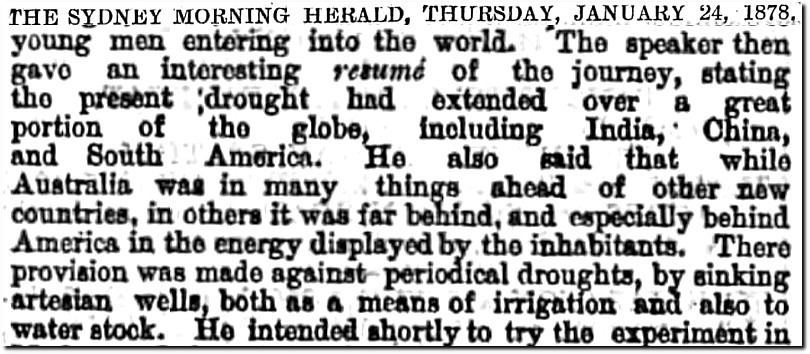
24 Jan 1878, Page 7 – The Sydney Morning Herald at Newspapers.com
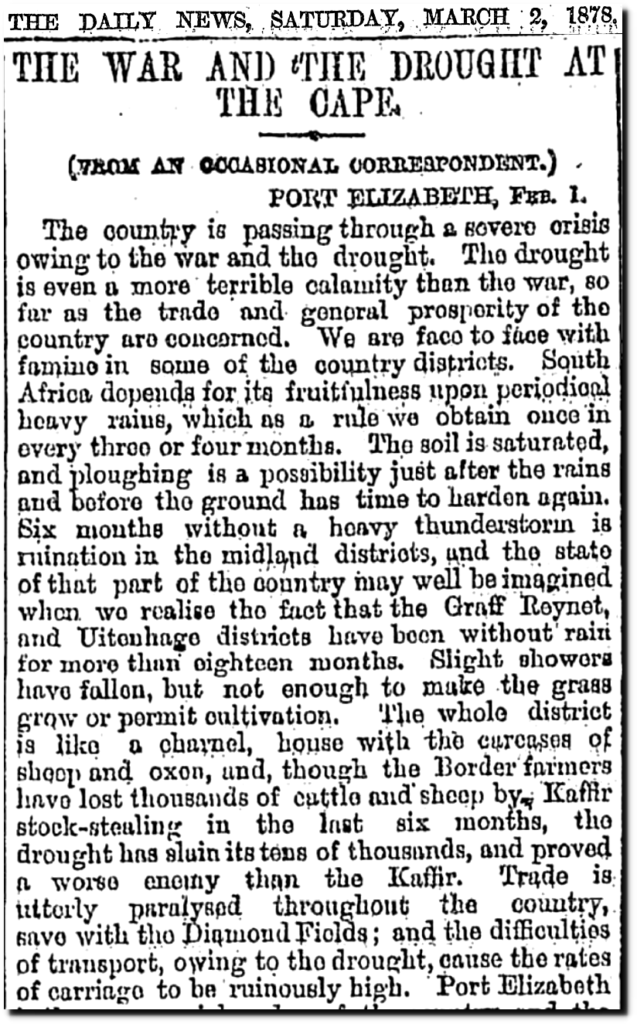
02 Mar 1878, 6 – Daily News at Newspapers.com
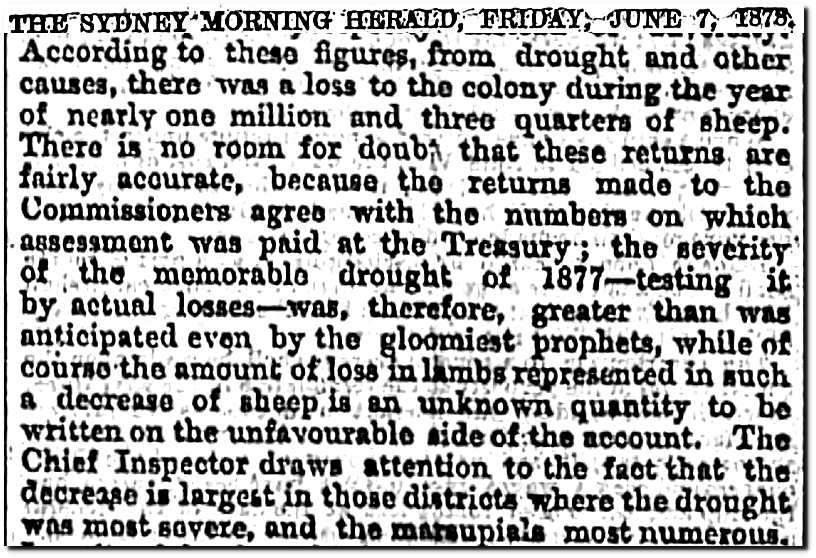
07 Jun 1878, Page 7 – The Sydney Morning Herald at Newspapers.com
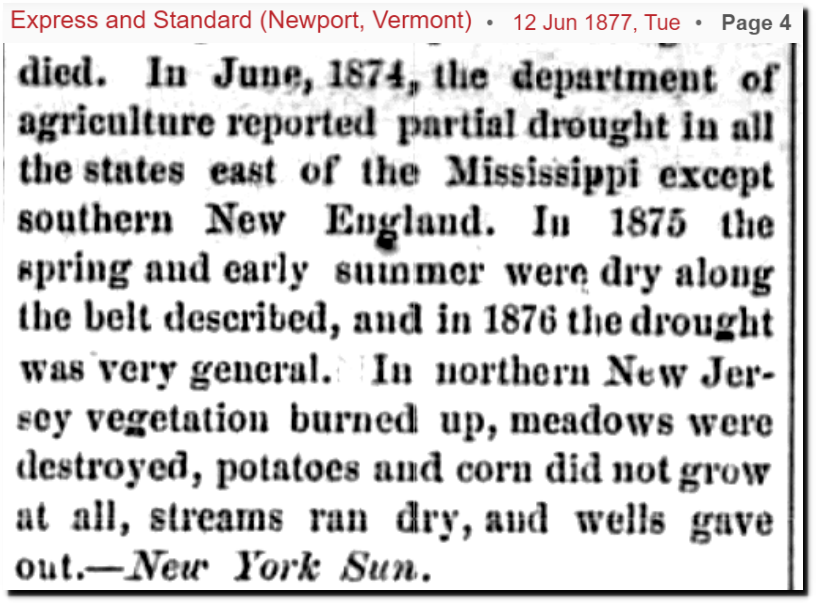
12 Jun 1877, 4 – Express and Standard at Newspapers.com
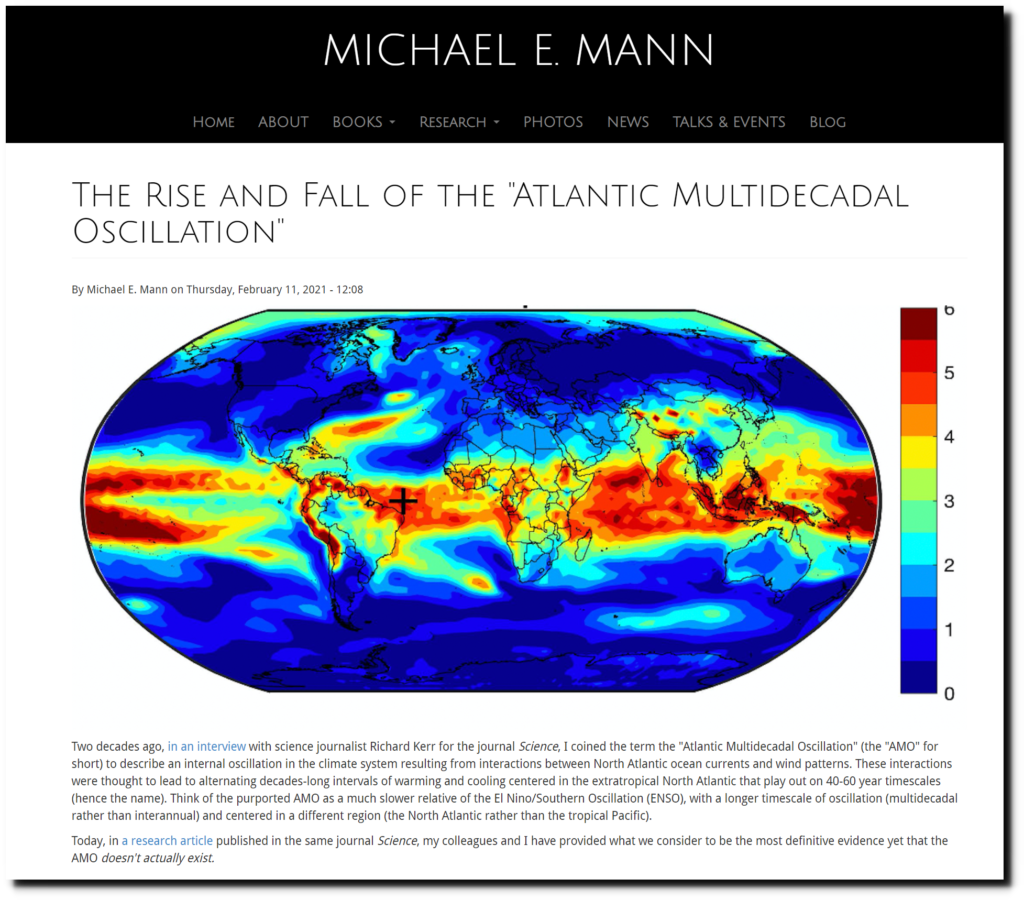
This didn’t suit the agenda of climate alarmists, so Michael Mann is now trying to erase the AMO.
The Rise and Fall of the “Atlantic Multidecadal Oscillation” | MICHAEL E. MANN

