http://docs.lib.noaa.gov/rescue/mwr/064/mwr-064-07-c1.pdf
Joe Romm tells us that the hot summer of 2010 on the Eastern Seaboard is proof of global warming.
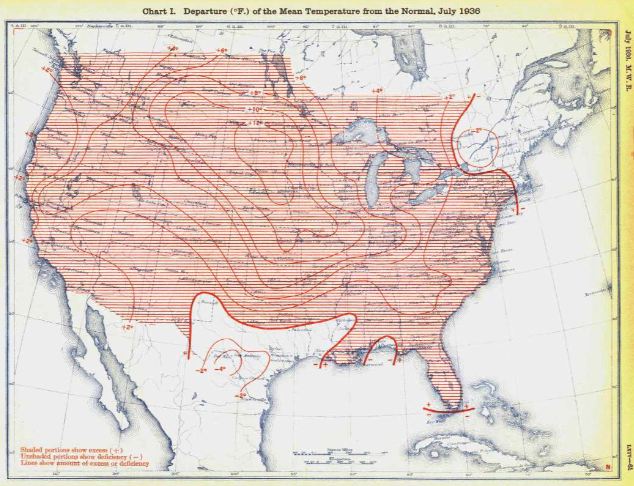
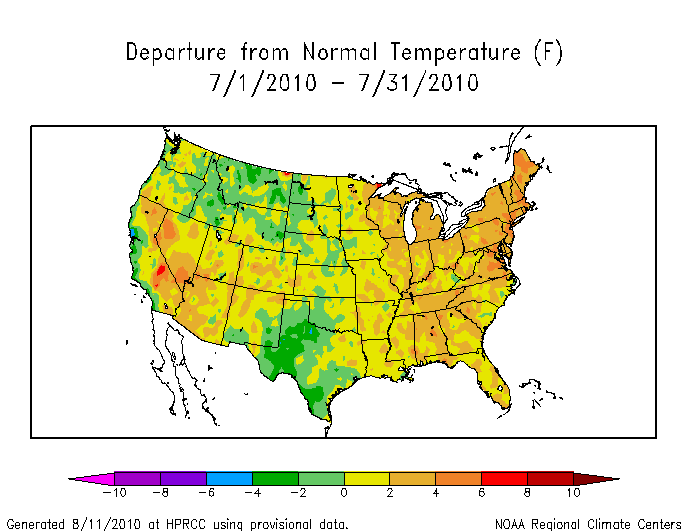
Compare July 2010 below (hottest year on record) vs. July 1936 above.
http://www.hprcc.unl.edu/products/maps/acis/Jul10TDeptUS.png
The heat this July didn’t compare with July, 1936 – when temperatures were 12 degrees above normal in the center of the country. Not even in the ballpark.
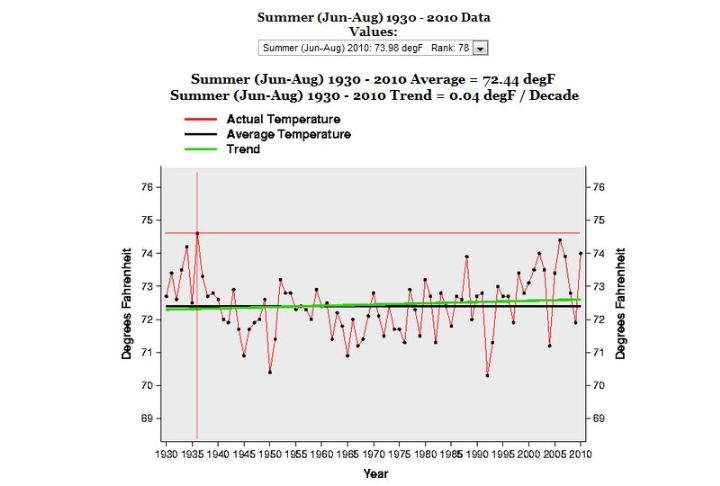
For the entire summer, June-August 1936 stands out as the hottest on record – even after all the upwards adjustments to recent temperatures. Atmospheric CO2 was 310 ppm in 1936, indicating there was no correlation between the heat and CO2.
http://cdiac.ornl.gov/epubs/ndp/ushcn/ushcn_map_interface.html
Belief in global warming depends on keeping people in the dark.


Hi Steven. Nice site. You may be interested in this I have done up here in Canada:
http://cdnsurfacetemps.blogspot.com/
Going to add your blog at the top.
You may also be interested in this I’m doing (which is why I haven’t posted in the previous for a while, but will soon, showing 2010 was not anything unusual).
http://ontariowindperformance.wordpress.com/
Richard
Thanks! I will have a look.
What is the state or region covered by the above graph?
You neglected to show the header which notes the state/region displayed on the NCDC site such as the following:
Climate At A Glance
Summer (Jun-Aug) Temperature
Central Region
Some of the following data are preliminary and have not been quality controlled.
For official data, please contact the NCDC Climate Services and Monitoring Division at [email protected].
And shouldn’t you have given credit to the NCDC site for producing the graph?
That 1936 data has been preliminary for almost 75 years.
For ” Some of the data is preliminary and has not been quality controlled”
Read ” We have not had a chance to hide the decline”
Joe Romm tells us that the hot summer of 2010 on the Eastern Seaboard is proof of global warming.
Should that say ‘proof’ or ‘spoof’?