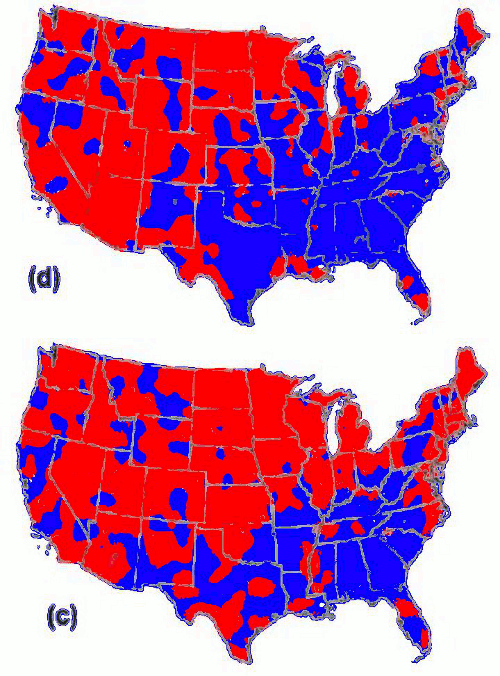
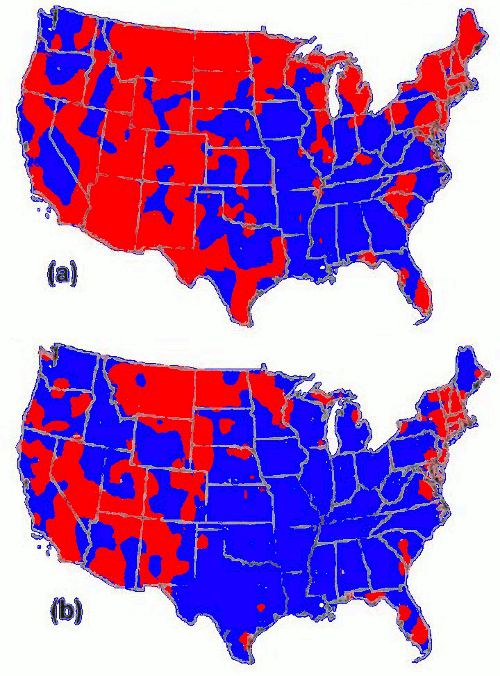
GISS US temperature data is based on the USHCN2 historical network, which adjusts recent thermometer readings upwards by a substantial amount before releasing the data to the public. The before/after blink comparator above shows that before adjustments, most of the US has seen cooling or neutral (blue) nighttime temperatures since 1895. (Some global warming eh?) But after adjustments, more than two thirds of the US shows warming (red) nighttime temperatures.
Same thing for daytime temperatures. Before adjustments, about three quarters of the US has cooled or remained the same (blue) since 1895. After adjustments, more than half of the country has warmed (red.)
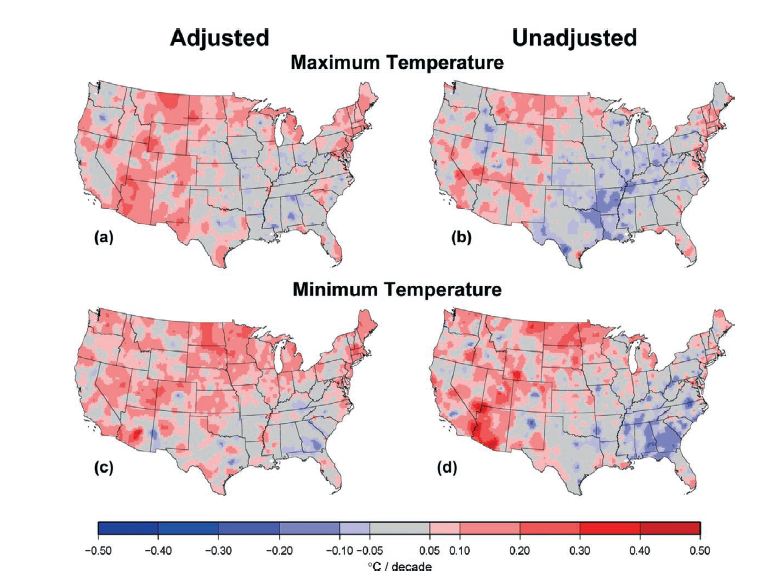
The original USHCN diagram is shown below. Their colour scheme makes it a little harder to see what is going on.
The normal procedure would be to display error bars, rather than firing off unmarked adjusted temperature graphs to the press and politicians.


Many of your posts I `like’. However, not this one. I took a quick skim of the document you reference. Having worked with large geochemical data sets I recognize that there are always data issues that need to be addresses. e.g. rediculously large (small) values, data switches between columns, obvious breaks in the data, places where there is the same high-low number, obvious strips of data that are clearly wrong….. on and on. Time of day measurement changes for temperature, etc.
You correctly show before and after. But you lead the reader with an impression of, “Hey, what are they doing”? Thats fine because that is what you want to show. But you haven’t discussed the coprrections and pointed out why some or all are not necessary.
This is a rare case where your post is misleading without further discussion and justification.
but just a thought.
Phillip,
As I stated at the bottom of the post –
The normal procedure would be to display error bars, rather than firing off unmarked adjusted temperature graphs to the press and politicians.
Wouldn’t you expect error to follow a more normal Gaussian distribution, rather than always biasing towards lower temperatures?
Thats a tough one to answer Steven. One would think that adjustments to a data set would result in maintaining a similar data distribution. However thats just off the top of my head. For the temperature data, to answer that question I would
really have to sit down and examine the raw data and look at each type of adjustment, and how it plays out within the raw data.
My initial `guess’ is that each adjustment would be independent of the others (again I’d have to do it to know for
sure). Then if there were enough randow adjustments, with each different type of adjustment being randomly either correcting toward warm or cold, then I’d look for a normal distribution.
But this doesn’t appear to be the case. I think I saw where the time of day when measurements were taken changed from the early part of the data set to the more recent…….. so this would be a skewed adjustment. Adjusting crazy big or low
numbers ….. I don’t know ….are the outliers more often crazy cold, crazy warm, or equally distributed around the
mean and likewise equally distribeted based on magnitude ….I dont know. So answereing your question is, I don’t
know. I do know that whoever does these adjustments should be intimately familiar with the data sets.
In geochemistry, a less than detection limit is often treated as 1/2 that value, as putting in a zero is wrong, so is
putting in 1/2 detection. If the data set ranges from say 100 to 2 ppm, if you take out 50 zero’s, it will have a lot less
effect than taking out 50 numbers ranging from outliers of 150 – 1000 ppm. Even the probability of recognizing when there are data shifts, say between columns isn’t random. If only a few columns contain predominantly `big numbers’, versus the vast majority of the columns having much smaller values, then its easy to recognize a switch of big for little, but much more difficult recognizing a swithc for little vs little. So recognition of column switches isn’t randomly distributed.
What I do know for sure Q&C for large data sets is a real pain in the butt …..
I had a min/max thermometer when I was a little kid, and the TOBS issue was painfully obvious. So I reset the min/max thermometer in the evening. I suspect that most observers were clever enough to do the same. In fact, you would have to be fairly daft not to have recognized it as a problem.
I’m writing some code to test out if the data really shows any systematic TOBS bias.
The problem is that GISS have not done exactly what you suggest, i.e. discuss and explain the adjustments.
That’s a very good point. It’s one thing to be lax when working in some obscure area that no one cares about. But when we’re being asked to change the way of life for the majority of the world and be hammered by trillions in taxes, I think every little detail needs to be disclosed.
I’m thinking that a person intimately familiar with the data would be able to make a summary (both written and in presentation format) of the reasons and ways data is adjusted with several example sets within a week’s worth of time, easy. However, if they’re trying to hide something that won’t be so easy and might be impossible altogether.
-Scott
Steve
I dont know if you ever saw our article on cooling trends?
http://wattsupwiththat.com/2010/09/04/in-search-of-cooling-trends/
It was remarkable for how many cooling spots there are in the US.
tonyb
Pingback: Say what? | Sullivan's Travelers
http://objectivistindividualist.blogspot.com/2009/12/rural-us-sites-show-no-temperature.html
For another interesting analysis using GISS data, see the website above. US data used, beginning about 1900, a variety of cities and for each, a separate compilation of temps for the surrounding country-side. (Urban/Rural). Rural shows no increase in temp, whereas urban areas do (likely UHI effect, because it has no impact on surrounding rural areas.
It surely looks impressive – as a potential manipulation – but I do agree one has to be careful: there are often many very good reasons for adjustments and it is not true that the adjustments at different places always have to be random and independent of each other. The reasons for adjustments may have a “general theme” across the country which could explain why most of them come with the same sign, too.
It seems to me that a simple test of the TOBS claims would be to count how many pairs of consecutive days have identical high and low temperatures. This would place an upper bound on the TOBS potential.
I’m just having a difficult time believing that observers would be negligent enough to not reset the minimum temperature on their max/min thermometer later in the day, or vice-versa.
Colour me stupid, but what does TOBS stand for?
Time of observation bias. Max-min thermometers, if reset at the wrong time, will duplicate one day’s reading on the next day.
OK, I am sorry but I didn’t say the source of bias has to be TOBS. The reason I didn’t say it – unlike you – is that the source of bias that has to be corrected does *not* have to be TOBS.
There can be all kinds of changes from one type of thermometer to another – that are known to be relatively shifted, because of different colors and so on; systematic shifts of stations “slightly away from the city centers” or “to higher altitudes above the ground” and many other things that may justify one to add a systematic mostly-warming correction.
Steven, you write: “I’m writing some code to test out if the data really shows any systematic TOBS bias.”
This is very needed for! Good idea.
Its quite funny how world wide, there shold be a trend in the times of measrements leading to “too cold” temperatures – or a trend in altitudes leading to “too cold” temperatures (As if all countries gradually moves their stations higher and higher) etc etc etc. The TOBS TEST you suggest is poison for AGW… i believe.
K.R. Frank
I appreciate the scientific discussion, it is interesting and I am sure you all care and know what you are talking about. But you don’t have to be a scientist to know that a trace, benign, beneficial element in the atmosphere is not causing global climate disruption. You also know that when so-called scientists have been caught manipulating, distorting and cherry picking data they are no longer either scientists or credible unless their peer review group includes skeptics.
No doubt Jim Hansen will contact you tomorrow explaining exactly how and why the adjustments were made and continue to be made on a fairly regular basis. I’m particularly fond of their “nightlights” adjustment for UHI and the total disregard for individual station siting.
I have every respect for the GREAT Lubos ( no irony, I love his blog ) and Phil Finck but if it looks like a duck… etc.
The website I posted in my earlier comment is interesting in that it uses the long-term GISS data (supposedly already “homogenized” ) and nonetheless shows that it is highly unlikely there has been any significant warming in the U.S. over the past 110 years. Since I believe that even the IPCC folks would argue that rural temperature readings are more desirable than urban data because of the UHI effect (altho’ still plenty of local environment issues), you would think they would have been quick to deflate that Urban /Rural study (it’s been around for some time). Any teachers out there who want to assign some of their students the job of confirming/rejecting that study?
I have asked several times if raw and adjusted data with annotations indicating the reasons for the adjustments are publicly available. No one (including the crowd at Real Climate) has indicated that this information is available. Maybe I have been influenced too much by the sloppy record keeping at CRU and the futile efforts of one poor person to make sense of them (as revealed in one of the released documents), but my concern is that there are no careful annotations indicating the basis for the adjustments. Has anyone here actually seen these data sets with the code used for adjustments?
You can get raw, tobs and final for any individual ushcn station – for example
http://cdiac.ornl.gov/cgi-bin/broker?_PROGRAM=prog.climsite_monthly.sas&_SERVICE=default&id=051528
Pingback: US Temp Data Shows Cooling Since 1895 - US Message Board - Political Discussion Forum
Has the work ~ever~ been done that could accurately “correct” data taken (even today) for the myriad variables that might influence a measurement throughout the year? Year to year?
Even if best practices are followed for sensors, instruments and housing, are the influences of the local area climate well understood (and verifiably so) such that some kind of correction methodology could be applied consistantly?
Do scientists in this field rely on statistical analysis of large arrays of data to eliminate variance in data collection methods? Are these techniques well understood?
Are we to assume that someone at NASA is on top of all this – and that their Cray computers are also coded and capable of making all these corrections (and many more) on sets of data taken 100+ years ago – and offset errors to result in NIST quality equivalent data accurate to tenths of a degree C?
Impressive.
I think the answer to Kevin’s question is obvious. Recently some of NOAA’s data was found (by “outsiders” of course) to be “slightly” off (i.e., temperatures recorded above boiling water). In response NOAA activated the usual governmental defense, circling its wagons, but the wheels all fell off.
Pingback: July 1936 – Hottest On Record | Real Science
TOBS implies that you measure the actual temperature at that time: not the extreme temperatures on a max min thermometer.
You can only take one temperature reading at a time. Tough job to record the maximum at 6am.
In that case, changing TOBS will just introduce a step change which should be pretty obvious to spot.
http://www.ncdc.noaa.gov/oa/climate/research/ushcn/ushcn.html#QUAL explains how it’s dealt with
Pingback: 2010 The hottest year on record - Page 14 - US Message Board - Political Discussion Forum
Pingback: TWAWKI » It’s going to get very, very cold
Pingback: The truth of Global Warming