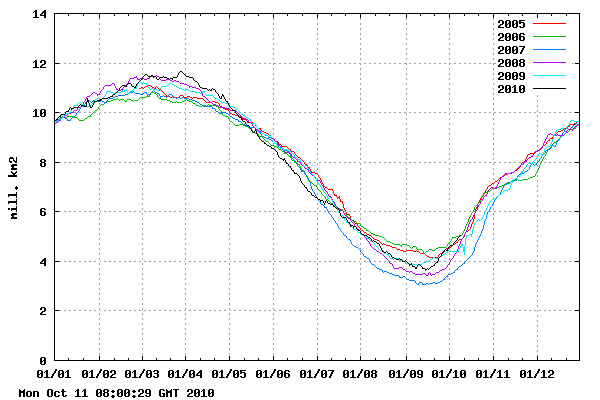
The Danish Meteorological Institute has been tracking Arctic ice extent since 2005. They use the more meaningful 30% concentration standard, and as of today show 2010 as the highest on record for the date.
Ice extent is now more than a million km² (17,000 Manhattans, 318 Rhode Islands, or 10 United Kingdoms) higher than 2007. New ice is forming at a rate faster than one Manhattan every two minutes.
Here is a meaningless apples vs oranges statistic – the type which alarmists love to use. In order to drive across Manhattan (13 miles) in two minutes, you would have to be traveling 390 miles per hour.
http://ocean.dmi.dk/arctic/icecover.uk.php
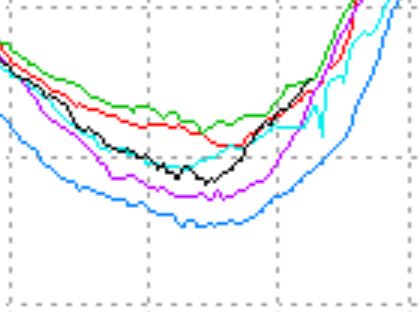
Close up below :
This is solid evidence of several things.
- Temperatures in the Arctic are very cold. Holdren’s claims of ice free Arctic winters are the thoughts of a scientific incompetent.
- The late August reduction in ice extent due to wind, had little or no effect on water temperature or the Earth’s radiative energy balance.
- The 2007 “record minimum” was not a trend, and the ice is recovering.


Did you report on the record low in the DMI database in June? ;o)
I’ve discussed everything about the Arctic ice on a weekly or daily basis for the last few years, including graphs.
Please can you give a link to the article where you discussed the June ice extent?
P.Sp I did try the search facility, but it didn’t provide the article from the obvious seqrch queries.
Look on WUWT. This blog has only been active for six weeks.
LOL, found it, you drew attention to the record low by making disparaging comments about other articles commenting on it!
http://wattsupwiththat.com/2010/06/27/the-list-goes-on-%e2%80%a6-and-on/
You found one article out of about ten. Nice detective work.
o.k. so provide a link to an article where you give more balanced coverage of the ice extent in june.
“The 2007 “record minimum” was not a trend, and the ice is recovering.”
It is called “regression to the mean”, extreme events (particularly records) tend to be the results of a combination of factors all coming together at the same time, so you tend not to get record years one after the other. The fact that the minimum this year was higher than the 2007 minimum is not evidence of a recovery, it is more than likely just the result of interannual variability. It isn’t much of a recovery anyway given that the minimum was the third lowest according to the NDISC, so lets not get carried away just yet shall we?
http://stevengoddard.wordpress.com/2010/10/09/look-for-a-record-gain-in-multi-year-ice-this-autumn/
Your post said that the record high in the DMI dataset was evidence of a recovery. It isn’t, posting some other line of evidence doesn’t change that. One swallow does not a summer make, that applies to this years sea ice extent just as much as that for 2007. For evience of a recovery you would need to demonstrate an increase in sea ice extent that can’t be explained by interannual variability (i.e. demonstrate a statistically significant trend).
2008,2009 and now 2010 minimums are all higher than the 2007 minimum.
That describes a 3 year stability to a slow recovery trend.It is still well below the 1979-2009 mean.
Your over the top language can not dispute the fact that SINCE 2007,the minimums have been significantly higher.
No, “significantly higher” would imply the use of some statistical test had been performed to determine whether the difference was explainable by interannual variability or not (i.e. whether there was evidence that it was higher becuase of some change in arctic sea ice extent or whether it is explainable as the result of chance).
The 2010 minimum sea ice extent is about what you would expect from the long term trend (see e.g. http://tamino.wordpress.com/2010/09/22/i-got-lucky/ ), so it isn’t evidence of a recovery.
Just under 3 UKs a day, huh?
More like one UK every two days.
OMG the 2mm sea level rise is going to kill us alllllllllllllllllllllllllllllllll
http://www.telegraph.co.uk/earth/earthcomment/geoffrey-lean/8051922/Water-mining-is-now-a-prime-culprit-for-raising-sea-levels.html
Time to watch Water World again LOL
24 hours ago you made almost the exact same post … cherry picking is still a hard habit for you to break.
http://stevengoddard.wordpress.com/2010/10/10/dmi-arctic-ice-extent-close-to-a-record-high/#comment-3803
Why not just chop prior to 2007 off the graphs too? (I bet WUWT has already done this somewhere)
Hansen has data going back to 1880. Why does he quote trends from 1975?
Because the older data is less accurate.
Correct me if I am wrong but I don’t think satellites were circling the planet in 1880.
Hansen doesn’t use satellite data
It’s too bad we didn’t have satellite data for the last 1000 years of Arctic ice. If we did ‘global warming’ wouldn’t talk about Arctic ice because current ice would be too large compared to 100o ago to try to scare people whit it.
Nonsense, Hansen uses satelite data in this paper for example,
http://www.sciencemag.org/cgi/content/abstract/309/5740/1551
read it here
http://www.arl.noaa.gov/documents/JournalPDFs/SanterEtal.Science2005.pdf
The GISS data set uses ground based temperatures.
Yes, that doesn’t mean that Hansen doesn’t use satelite data though. Good scientists check to see if their findings are robost against multiple sources of data, not just assume theirs is the only one that is correct.
Hansen’s trend numbers are GISTEMP numbers.
http://data.giss.nasa.gov/gistemp/
They are all based on ground /ocean based data.
Dikran
do you know what you are talking about?
you are repeating yourself again. I have already agreed that GISSTemp doesn’t use satelite data, but that still doesn’t mean Hansen doesn’t use satelite data, which was your claim. You seem curiously unable to admit any error, no matter how small.
BTW I think the likely reason Hansen used a 1975 start date is becuase it is about then that AGW is throught to have become the dominant forcing, so if he were making an argument about AGW, then 1975 is a fairly reasonable start date. It could also be chosen if he were discussing a prediction made prior to 1975. Difficult to know without having the proper context.
Hansen’s trend numbers are based on GISTEMP – ground based data. That is the topic of this discussion.
Just becuase Hansen is works on GISSTEMP doesn’t mean he isn’t allowed to talk about trends in satelite data.
Anyway, I have given an answer as to why Hansen might quote a trend from 1975, even using just GISSTEMP.
Hansen likes 1975 because it is a high point in ice amount, even though it may be the top of a cycle.
1975 definitely is an interesting year in global warming.
Steve- “In order to drive across Manhattan (13 miles) in two minutes, you would have to be traveling 390 miles per hour.”
What happens when this reaches the speed of sound? Oh no, another tipping point…
it’s all a blur
http://blog.oregonlive.com/oregonatwar/2008/03/f18soundbarrier.jpg
http://www.youtube.com/watch?v=wHrwgRsX0BI&feature=related
Dikran Marsupial shut up and go to Antarctica
LOL!
The 2007 “record minimum” was not a trend, and the ice is recovering.
…………………………………………………………………………………………………………………………….
I think 2007 was normal. I bet it has happened many time before in Arctic ice. There was less ice in the Arctic 1000 years ago than now. There’s evidence that there’s more ice in the Arctic now than there was in the past 9000 years.
But global warmers want to convince people what’s happening now is dangerous.
Heres Hansen data compared to CRU and satellite data:
See how GISS changes?
part 1
http://www.youtube.com/watch?v=6ROMzxA4A9c
part 2
http://www.youtube.com/watch?v=w8ZhWZj8zfQ
When superimposed against the recently experienced super El Nino, the current recovery is remarkable but not unexpected. This quick recovery would suggest that the steady state (non El Nino affected) ice extent for this period has been significantly suppressed by spurious weather and that what we are seeing is a return to a more normal extent that may be greater than the 6 year historical record as shown in your graph.
This puts the ice recovery back on track.
I think recovery implies something happened that needed to be recovered from. I think 2007 was a normal occurrence that has happened before. We just didn’t have a satellite record to see it. It looks like everything that is happening in climate now is normal and has happened before.
But at the same time I did understand why you used the word recovery. It’s common for both sides to use it.
I think one side should stop using it. Because using the word makes it look like something injurious happened that needs to be recovered from.
Yes that arctic ice is “recovering” until it grows without bound and starts covering landmasses – then it will be “encroaching”. I get what you are saying though – how can a big chunk of sea-ice “recover”. Ice melts. Water freezes. Neither “recover”.
Well, the idea of recovery means something happened that harmed Arctic ice and it has to recover from it. I think what happened in 2007 was a normal thing. Just more normal variation. It’s as normal as sunrise happening at a different time throughout the year. The time of sunrise doesn’t start to recover after December 21st.
I don’t think the actual value matters that much at the moment, we know it will likely have a close spread come November, I’d say the same if it was too low by the way.
Andy
Area still low
http://arctic.atmos.uiuc.edu/cryosphere/IMAGES/seaice.recent.arctic.png
Andy
Pingback: Hottest Year Ever : Both Poles Now Have Record High Ice Recent Extent | Real Science
About the only way to spin the present arctic ice extent/volume is to ignore pre-1975 historical evidence from many different sources, e.g. ship logs, recent core data, etc. By ignoring pre-1975 data it eliminates historic climate variations. Then you can call post 1975 ice `a decline’, a tipping point and all is lost. Consider pre-1975 and the arguement totally collapses. As a scientist I am continuously amazed by the bias and frankly the stupidity of these climate scientists. It is bizarre, and then the trolls pick it up and quote it as gospel. Can’t they simply look at the matter with some sort of perspective? This isn’t difficult…… in fact when it is explained to any non-scientist, in my experience (and I have a lot), within about 10 minutes their opinion completely changes. That is just the general `Joe and Jane’ on the street.
What in nature doesn’t have long term cycles (long term varies depending on what your referring to). Rabbit, deer, wolf populations. episodic volcanic eruptions. Earth quakes. Fish populations. Bug infestations. Trees as they move through initial to climax forests, fires, start all over again. Civilizations. Plagues. CLIMATE, TEMPERATURES,ICE EXTENTS, human life from great- grandparent grandparent, parent, baby, and start at the other end at worm bait.
The only long term steady state in anything is an artificial line drawn on a long term cycle. This is the entire problem with the AGW theory…….. the lack of understanding or refusal to accept the fact that things cyle on periods of seasons, years, decades, centuries, milleniums, Millions yrs, eras, geological periods, star birth and death………….
The world as we know it didn’t start in 1850, 0r 1900, or in the average of 1900 – 1960, or in 1975, or in 2000 to present…… ugh.
It is dumb, dumb, more dumb, less dumb and just plain studid.