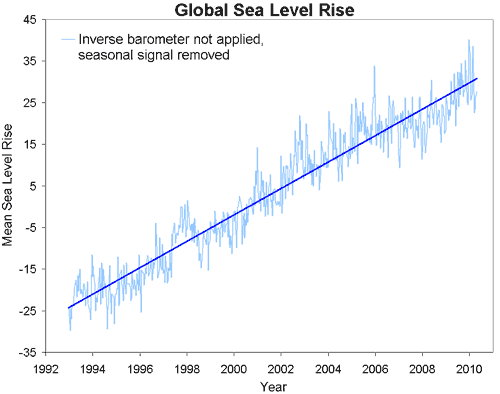
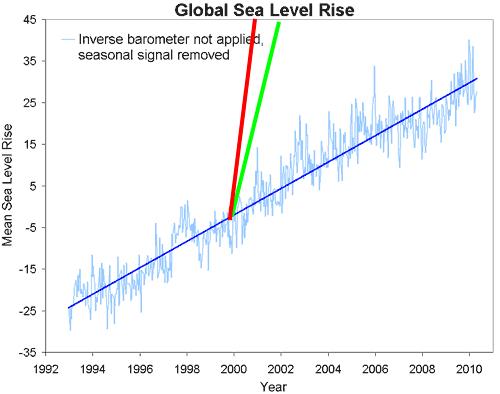
Joe Romm dependably took the bait, and produced the graph below – which shows that sea level is rising at a rate of 12 inches per century – with a drop since the start of 2010. Of course he didn’t bother to put any units (should be mm) on the graph, because he correctly assumes that his normal audience isn’t very bright.
But wait a minute! Joe has been telling us that it is the hottest year ever, and that the Greenland and Antarctic ice sheets are melting like crazy. Shouldn’t sea level be rising much, much faster? After all, Hansen is forecasting 3-6 metres (10-20 feet) of rise this century.
To help Joe out, I added 3 metres/century (green) and six metres/century (red) trend lines to his graph below.
Hansen’s numbers are 10-20X too high, but that doesn’t seem to bug Joe at all. Pretty ridiculous, but standard Romm fare.
Over the last five years sea level rise rates have fallen 30%. Proving beyond a shadow of a doubt that ice sheet melt has not accelerated.
If sea level was actually rising at the rate Hansen claimed, the world would be in chaos and the highway near his Manhattan office building would be flooded. That is not the kind of thing that would go unnoticed.
————————————-
http://www.grist.org/article/yet-another-must-read-by-james-hansen/
Under BAU [business as usual] forcing in the 21st century, the sea level rise surely will be dominated by a third term: (3) ice sheet disintegration. This third term was small until the past few years, but it is has at least doubled in the past decade and is now close to 1 mm/year, based on the gravity satellite measurements discussed above. As a quantitative example, let us say that the ice sheet contribution is 1 cm for the decade 2005–15 and that it doubles each decade until the West Antarctic ice sheet is largely depleted. That time constant yields a sea level rise of the order of 5 m this century. Of course I cannot prove that my choice of a ten-year doubling time for nonlinear response is accurate, but I am confident that it provides a far better estimate than a linear response for the ice sheet component of sea level rise under BAU forcing.
– James Hansen
The West Side Highway [which runs along the Hudson River] will be under water. And there will be tape across the windows across the street because of high winds. And the same birds won’t be there. The trees in the median strip will change.” Then he said, “There will be more police cars.” Why? “Well, you know what happens to crime when the heat goes up.”
– James Hansen 1988. His forecast for 2008.


I think AGW can’t fail. So, James Hansen will always be right.
😉
There are many things wrong with Joe Romm’s asertains. Just showing how he has manipulated the scale ignores these other problems.
Cooling ocean(s)
An increase in the eustatic component from borehole water contribution.
Where is all the remaining EASY TO MELT ice located?
I can accept a sea level increase of several feet a year for a while,10,000 years ago,as being possible.
By now all the accumulated ice built up in the northern hemisphere during the last ice age advance has almost melted away.Therefore sea level rise will be but a fraction of what it was thousands of years ago.
It is too cold in most of Greenland and Antarctica for ice to melt fast enough to add the needed water run off.To support such a massive increase in sea level rise.
Joe Romm who has a science degree should be able to see that easily.
Excuse me! “Sheet ice” or “ice sheet” is afloat, is it not? Even “shore-fast” ice is afloat within a small distance from shore, unless it is supported by rocks, etc. Being afloat, it matters not a whit re “sea level” whether it (the ice) is solid or liquid.
Ice sheet is a term used for glacial ice in Greenland and Antarctica
NASA is known to have problems converting Imperial to metric.
12″/century x 0.305 = 3.66m/century
Easily in NASA GISS’s range 3-6 m, and that is why you were clearly forced to photoshop your recent picture of La Jolla beach to de-submerge it from its current location more than 5 metres beneath the waves. See I can do arthmetic!
“This was the moment when the rise of the oceans began to slow and our planet began to heal.”
– Barack Obama
June 3rd, 2008
“Joe Romm dependably took the bait,”!!
I signed up to this blog because I thought it was about ‘Real Science’, but it looks more like a pissing contest between bloggers.
So where is the Real Science?
The Royal Society’s latest and most sceptical report says “Because of the thermal expansion of the ocean, it is very likely that for many centuries the rate of global sea-level rise will be at least as large as the rate of 20 cm per century that has been observed over the past century.”
That will be in additional to any “enhanced melting and retreat of the ice sheets on Greenland and West Antarctica”, which it still says there is insufficient understanding to predict. That is where the Real Science is, not in some hissy spat between bloggers.
Pingback: More about the forecast for flooded cities in the late 21st century « Fabius Maximus