
The “Oregon Climate Change Research Institute” says that Oregon will warm two to ten degrees this century. This stunning report had “70 authors from universities, state and federal agencies and other groups” – but apparently none of these esteemed experts know how to use Google.
If they did, they would know that Oregon has been cooling over the last 25 years and has dropped over two degrees during the last seven years. They would also know that 2008, 2009 and (soon) 2010 are three of the five coldest years in the last quarter century.
They would know that Oregon is cooling, not warming. I wonder if the Oregon Climate Change Research Institute has an agenda?


Oregon can burn up. I’m not sending my money to them to pay for their plan for stopping it.
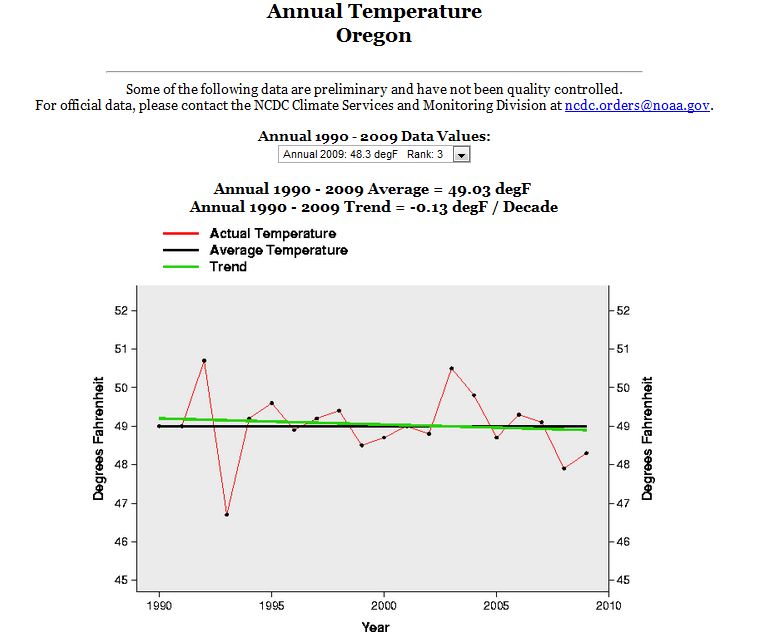
The graph from NOAA shows an upward trend of 0.9 degree F per year when plotted from 1970 to 2010.
If you plot 1985 to 2010 it shows an upward trend of 1.01 F.
Your link suggests that Oregon is warming, not cooling. Why do you say it is cooling?
http://www.ncdc.noaa.gov/oa/climate/research/cag3/or.html
There was a step upwards in 1985 and it has trended downwards – ever since CO2 hit 350 ppm – for the last twenty five years of unprecedented global warming.
OK but if we plot from 1986 (to avoid the step up you mention in 1985) to 2010 the graph still trends upwards (but less so). If we plot from 1987 the trend is higher again. You have to be quite selective in the choice of dates to come to the conclusion that Oregon is cooling.
It just strikes me as odd that you would take these people to task for not picking the years you did, when you haven’t really explained why those years are the right ones to use when judging the temperature trend in Oregon.
Nyq Conly
It’s you that’s cherry picking you stupid fuck. The earth is supposed to be warming since 1985. How convenient of you to take 1985 out of your calculations, that way there is warming and not cooling.
Nyq Conly, the scientific term for what Steve has done is called ‘Cherry Picking’. What is notable is that his ‘sceptical’ readers are totally un-sceptical of this being done when it supports their conformational bias.
Well I think the clearest example of a lack of thinking amongst the comments was from Mr/Ms Meterorites. Who objected to my comments with “How convenient of you to take 1985 out of your calculations, that way there is warming and not cooling.” Apparently unaware that Steve Goddard was the one who had suggested there was an issue with 1985 , and also apparently unaware that if we include 1985 the warming trend is LARGER. Arguably I did “cherry pick” when I excluded 1985 but only to try and make Goddard’s cooling claim look more plausible (and even then the trend was still positive).
Some knee-jerks to criticism going on around here and an assumption that swearing is an adequate substitute for rationality.
But since 2003, the trend line is way down. Just goes to show that there are multiple ways to interpret the same data!
🙂 and if you plot from 2004 the trend is back up again. Shorter intervals will show more volatile “trends”. The question is what timescale to pick – and that depends (if you are being rational and scientific) on the question you are asking.
In the case of this report (which I haven’t read) from “OCCRI” (http://occri.net/ocar) they are dicussing trends over a century, not trends over a fraction of a decade. So what we should look at is whether it is reasonable to talk about a century long trend in Oregon’s temperature. So rather than 1985 to 2009 or 2003 to 2010, the ‘right’ time interval to look at would be 1910 to 2010.
No it isn’t.
Nyq Conly says:
December 1, 2010 at 2:52 am
the ‘right’ time interval to look at would be 1910 to 2010.
Of course that’s the right time, you mindless global warming believer fuck.
For a more correct time let’s go back to the Medieval Warm Period and observe all the cooling since then. Let’s quit the cherry picking you are laboring to do.
Oregon has been obviously cooling for a quarter of a century, It is amazing how people are determined to confuse themselves.
Sorry about the language Steven, it’s probably out of line.
It is amazing that anyone could see a 10 degree per century warming trend in that graph, but apparently we have some real climate geniuses around here.
Apparently that last comment caused some upset. Apologies for any offence caused. 🙂
Not upset, it’s just so predictable. It’s hackneyed that you guys continue to preach global warming when clearly nothing alarming is happening. It was warmer on earth 1000 years ago than now. But you guys go on and on about .6 degree warming over the last 150 years as if something unusual has happened. You are all broken records. You all say the same things. There is no imagination among any of you.
So now, the next time the talk of cooling comes up I already know what is going to happen—some global warming alarmist will choose a data point that shows warming and will try to scare people with it. Why do I know it? Because that’s all you can find alarmists doing.
stevengoddard says:
December 1, 2010 at 3:07 am
It is amazing that anyone could see a 10 degree per century warming trend in that graph, but apparently we have some real climate geniuses around here.
No thinking allowed in global warming. They just repeat everything they’ve heard.
Anyone who thinks will see problems in the entire global warming hypothesis.
Ms/Mr Meteorite really does seem a bit upset about the whole business. I find a nice cup of tea is always a help in such circumstances 🙂
We all see what we want to see.
Nyq Conly says:
December 1, 2010 at 4:03 am
Ms/Mr Meteorite really does seem a bit upset
You may be seeing things.
With weather in the Pacific Northwest being controlled by a multidecadal oscillation we go back 60mto 80 years and find a high point. Then we find the most recent high point in temperature. Without having multiple cycles to use for proper statistical analysis we use the two points to determine a recent trend.
Either 1934 or 1954 fits within the variable known periodicity of the PDO and any recent warm year would do. Rough glance it appears to be 2003. The temperatures for both years are about 39f and without enough data points we find no warming or cooling during that period. With 10 cycles we might be able to see a trend. Because natural climate variation can range from 17f to 39 f over this period and UHI and other factors have not been accounted for I would call it normal weather.
They might be looking at a repeat of 1937 in a year or two!
I specifically picked the warmest years due to not enough known long term weather patterns to test statistically. one complete cycle is to short.
are they really arguing about which start dates to cherry pick???
Actually I think Mr Goddard’s problem was the END date he picked. Apparently we have some real climate geniuses around here 🙂
The end date? 2009 was the last possible full year.