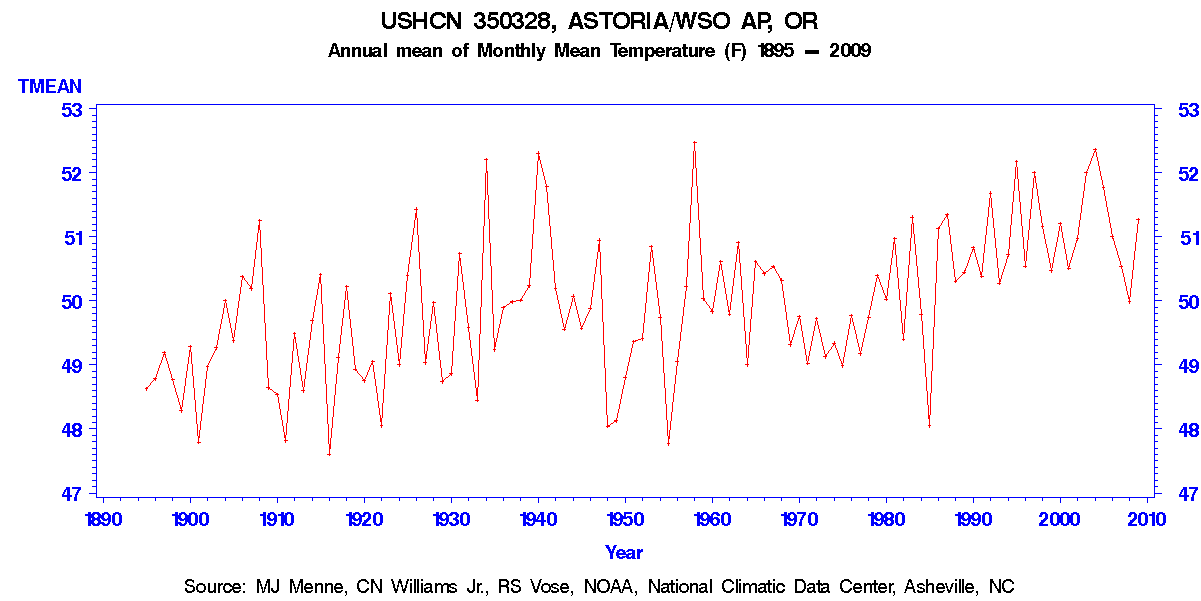
USHCN turns a cooling trend (red line) from the thermometers into an “adjusted” warming trend (blue line.)
Phil Mote, director of the climate change research institute at Oregon State University, agreed regional details can be fuzzy. But the general direction for Oregon and the Northwest is clear, he said, with no plausible scenario in which the region cools over the next 40 years.
“Right now we’re operating in this sort of murky time where we have a pretty good idea of the direction that things are changing, but not the rate or the magnitude,” Mote said. “So we can give vague advice to say, consider building bigger culverts (to handle potential surges in stream flows), but we can’t in most cases give precise values.”
Northwest temperatures increased about 1.5 degrees from 1920 to 2003, the research institute’s report says, “primarily” due to human-caused carbon emissions. Every Oregon station in the U.S. Historical Climatology Network showed an increase in annual average temperature in the 20th century, the report says, but total precipitation has fluctuated and trends in extreme precipitation that causes floods “are ambiguous.”
He forgot to mention that this is after USHCN has reversed the trends – from cooling to warming.
But after proper manipulation by USHCN – presto a warming trend.


BRRR – it’s warm up here.
As usual very interesting but the question is: Are ALL USHCN temperature station records have been fiddled in the same manner?
The vast majority of stations I have sampled show similar patterns.
So does anyone know what the earth’s temperature is really doing?
Here’s the punchline:
http://www.ncdc.noaa.gov/img/climate/research/ushcn/ts.ushcn_anom25_diffs_urb-raw_pg.gif
“The cumulative effect of all adjustments is approximately a one-half degree Fahrenheit warming in the annual time series over a 50-year period from the 1940’s until the last decade of the century. ”
http://www.ncdc.noaa.gov/oa/climate/research/ushcn/ushcn.html
Dear Mr Goddard,
I don`t comment on here a great deal, as I like to engage warm mongers directly, and most don`t seem to have the minerals to come on here.
However, this site is a rich vein of information for me and many others. Keep up the good work.
By the way, I have just won two FA Cup Final tickets in a photography competition. Can you assure me that the pitch won`t be scorched through drought, flooded, or just plain below sea level by then, as all this CO2 poison rien CAGW has got me worried.
Maybe buried in snow?
Galvanize I would love to see your winning photo here if you would be so kind.
It would seem like some of these crazy-adjustment stations could be cross-calibrated with the satellite data for their local gridcell. Performed in absolute temperature terms instead of anomaly terms, one should be able to directly show the error of the adjustments for non-urban sites.
I just love the smell of fresh roasted data in the morning….