No wonder Julia is hysterical.
Disrupting the Borg is expensive and time consuming!
Google Search
-
Recent Posts
- Gaslighting 1924
- “Why Do You Resist?”
- Climate Attribution Model
- Fact Checking NASA
- Fact Checking Grok
- Fact Checking The New York Times
- New Visitech Features
- Ice-Free Arctic By 2014
- Debt-Free US Treasury Forecast
- Analyzing Big City Crime (Part 2)
- Analyzing Big City Crime
- UK Migration Caused By Global Warming
- Climate Attribution In Greece
- “Brown: ’50 days to save world'”
- The Catastrophic Influence of Bovine Methane Emissions on Extraterrestrial Climate Patterns
- Posting On X
- Seventeen Years Of Fun
- The Importance Of Good Tools
- Temperature Shifts At Blue Hill, MA
- CO2²
- Time Of Observation Bias
- Climate Scamming For Profit
- Climate Scamming For Profit
- Back To The Future
- “records going back to 1961”
Recent Comments
- Bob G on Gaslighting 1924
- Bob G on Gaslighting 1924
- conrad ziefle on Gaslighting 1924
- Bob G on Gaslighting 1924
- Bob G on Gaslighting 1924
- arn on Gaslighting 1924
- conrad ziefle on Gaslighting 1924
- Gordon Vigurs on Gaslighting 1924
- conrad ziefle on Gaslighting 1924
- Robertvd on Gaslighting 1924


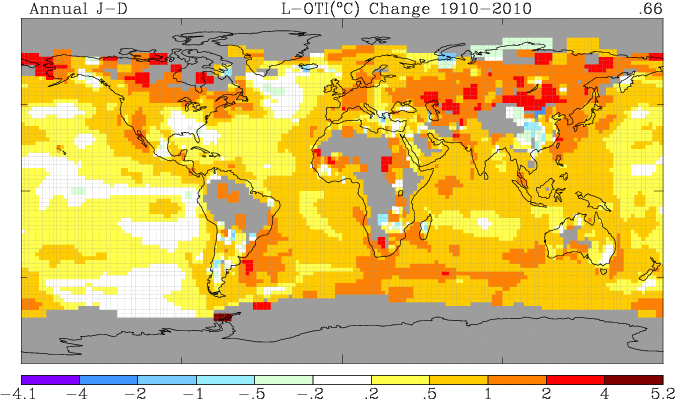
Amazing how many red bits are next to grey bits. GISS uses 1250 km smoothing you said? Astounding coincidence!
Looks like we’re in a period of European/Asian warming…bit like the Medieval Warm Period, eh?
I tried taking the timescale back to 1880 and much of the warming vanishes.
http://data.giss.nasa.gov/cgi-bin/gistemp/do_nmap.py?year_last=2011&month_last=04&sat=4&sst=0&type=anoms&mean_gen=0112&year1=1880&year2=2010&base1=1951&base2=1980&radius=250&pol=reg
I opted for the 250km smooth – no ocean – exposes their dodgy warming in Siberia and surreal grid cells over Spitzbergen.
That little white spot on the NW of Oz is Broome, not warming here either
Oh, what a tangled web we weave, when first we practise to deceive…
Steve, I dobbed you – see
http://blogs.news.com.au/couriermail/andrewbolt/index.php/couriermail/comments/gillard_feels_a_chill/#commentsmore
And, among the comments, you might like the list at
“CraigR replied to Maggie the global warming guru Thatcher
Wed 01 Jun 11 (11:45am)
The theory is every changing with what-ever the climatic weather we have or whether we have any climatic weather or not is the climatic weather we do or not will be the climatic weather man causes.
So the climatic weather we have or not is the “Anthropogenic Climate Change “theory we have.
If a slight warming is occurring it does not prove causation, however a cooling disproves the theory that man’s CO2 is the cause of a warming ….a large portion of AGW advocates claim that it’s all ways up, up and away. You simple can’t continually change the ‘Theory” to suit the circumstances otherwise it’s a self falsifying theory.
anti-AGW crown constantly misrepresent what AGW is?
Misrepresent ???? who’s doing that….. the constant relabeling over the years is amazing …..
Global cooling (GC)
Global dimming (GD)
Global warming (GW)
Man-made global warming (MGW)
Anthropogenic global warming (AGW)
Dangerous global warming (DGW)
Greenhouse effect (GE)
Human induced climate change (HICC)
Human caused climate change (HCCC)
Runaway greenhouse effect (RGE)
Climate change (CC)
Global Climate change (GCC)
Climatic Destabilization (CD)
Dangerous climate change (DCC)
Abrupt climate change (ACC)
Anthropogenic climate change (ACC)
Catastrophic climate change (CCC)
Catastrophic anthropogenic global warming (CAGW)
Global heating (GH)
Climate crisis (CC)
Climate destabilization (CD)
Global wierding (GW)
Climate chaos (CC)
Inadvertent climate modification (ICM)
Climate challenge (CC)
Climate disruption (CD)
Global climate disruption (GCD) “
Another Ian, loved the list, and don’t forget:
Climate Emergency
Can we really be accurate to 0.5 of a degree, even with all the sampling number of data points ? Are we even sure a degree resolution reflects reality? If that map had -0.5 to +0.5 as ‘white – no change’ then most of it would be white. Its amazing how much of the red is in areas with next to no measurement too.