
The Beaufort Sea was well below normal again today.
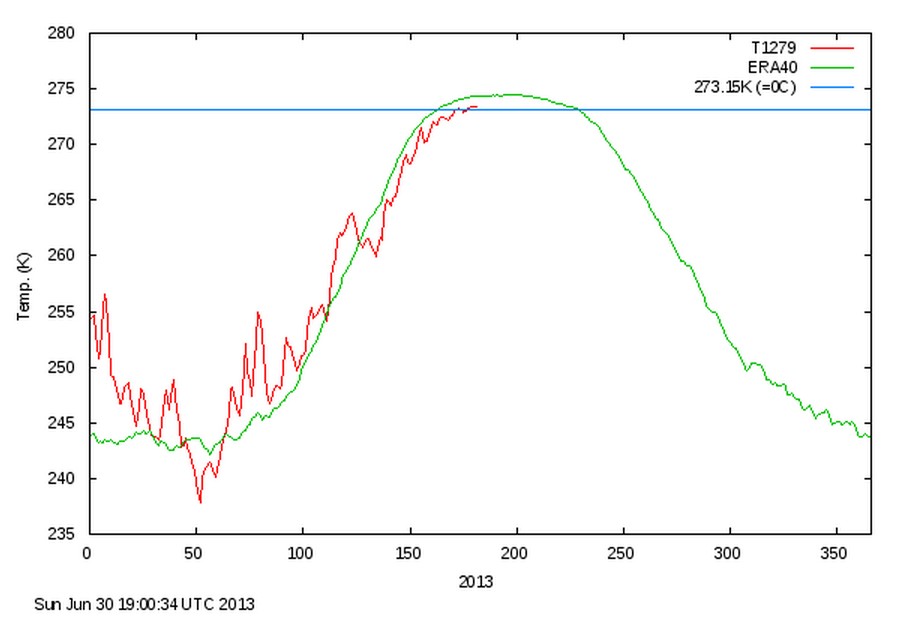
Temperatures north of 80N continue to be the coldest on record for the date.
COI | Centre for Ocean and Ice | Danmarks Meteorologiske Institut
The Beaufort Sea was well below normal again today.
Temperatures north of 80N continue to be the coldest on record for the date.
COI | Centre for Ocean and Ice | Danmarks Meteorologiske Institut

But Antarctica’s on fire!
And in it’s Winter yet!
Somehow the ‘hot’ water is not able to heat the arctic ice.
http://www.ospo.noaa.gov/data/sst/anomaly/2013/anomnight.6.27.2013.gif
Interesting the North Atlantic surface temps look cold. Maybe the ocean current from the Caribbean and Florida is just not as hot as previous years?
But the “rowers” will be skimming along in the galley of the good ship Lollipop, a Russian Icebreaker with 20K horsepower and a reinforced keel. Those Russkies sure know how to “Row”. Amundsen, eat your heart out!
It’s the Sun
http://youtu.be/4Taz18Ss1vU
Anyone see where the rowers are at? I can’t load the map on the Mainstream home page. Facebook says they are just in the Yukon, which still puts them 2, 3 or even 4 days from Inuvik.
…and why call them rowers until they are rowing, IN the “Northwest Passage”.
Halfway according to the tracker.’
“Blowtorch!” 😆
gator69
Kugluktuk, NU reached 91.5 F, Saturday, which is an incredible 44F above normal and broke the old record by 15F.
Kugluktuk is on the shores of the eastern Beaufort Sea
http://www.wunderground.com/history/airport/CYCO/2013/6/29/DailyHistory.html?req_city=NA&req_state=NA&req_statename=NA
That was the “BLOWTORCH” I referred to last week. It happened just as I predicted and you can’t deny it
We are not discussing land temperatures, unless the team is going to cheat even more.
When I lived in Europe, in Summer we would ski on glaciers, while wearing t-shirts and shorts. The air temperature was higher than that of the suface, and the snow did not melt.
Get a grip.
gator69 – when I lived in Calgary, Alberta, Canada, we would play hockey in t-shirts during a Chinook – the ICE would be frozen while the air temperature was MUCH higher then that of the STILL FROZEN ice. It would take a few days for the ice to melt (unless it was an UNUSUALLY WARM Chinook or LONG, but only a few Chinooks are that warm or lasted that long).
These situations are far beyond Reggie Pooh`s brain-damaged (form playing hockey)
ability to understand.
H’mm
I wonder why the wunderground entries for this station explicitly says
‘Averages and records for this station are not official NWS values’
Is there something dodgy about it?
Even more h’mm
If we go to the Environment Canada site to look at their records for June 29, we see that there were likely problems with the equipment that day. There was a two hour outage just before the very high temperatures began to be recorded, and a three hour period afterwards. The high temperatures feature only in the period between these two outages.
Examination of records for adjacent dates shows that this is not a part of daily procedures.
Prima facie, I would not be inclined to put too much credence on the records until the cause of the outages is better understood. And note the warning ‘Be aware that data can be erroneous and that some values may change over time as quality control procedures identify and deal with doubtful data’
http://www.climate.weatheroffice.gc.ca/climateData/hourlydata_e.html?timeframe=1&Prov=XX&StationID=1641&cmdB2=Go&cmdB1=Go&Month=6&Day=29&Year=2013&cmdB1=Go
Don’t let your pride in weather forecasting blind the forest from the trees….the answer is blowing in the wind my friend.
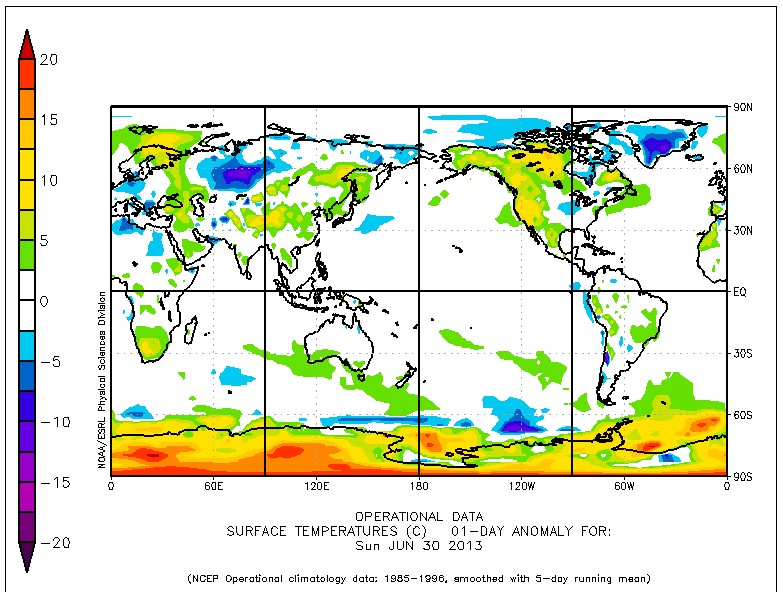
http://www.esrl.noaa.gov/psd/map/images/fnl/sfctmpmer_01.fnl.html
Here is a map of the ACTUAL observed temperatures, Are you still going to claim
that it’s too cold to melt ice? The rower’s situation is getting better every day.
The map is a model construct loosely based on some observed temperatures and a lot of guess work /extrapolation. In other words it is produced hoping people like you believe it represents the true temperatures.
If you want a “Blow Torch” Try riding a motorcycle through the desert southwest in the middle of the summer at midday. As far as your so called “record temperatures”, those are probably BS also. I have seen where they place thermometers and watched them do the readings.
Reggie:
For your entertainment, from GISS:
Q. If SATs cannot be measured, how are SAT maps created ?
A. This can only be done with the help of computer models, the same models that are used to create the daily weather forecasts. We may start out the model with the few observed data that are available and fill in the rest with guesses (also called extrapolations) and then let the model run long enough so that the initial guesses no longer matter, but not too long in order to avoid that the inaccuracies of the model become relevant. This may be done starting from conditions from many years, so that the average (called a ‘climatology’) hopefully represents a typical map for the particular month or day of the year.
http://data.giss.nasa.gov/gistemp/abs_temp.html
Also:
Q. What SAT do the local media report ?
A. The media report the reading of 1 particular thermometer of a nearby weather station. This temperature may be very different from the true SAT even at that location and has certainly nothing to do with the true regional SAT. To measure the true regional SAT, we would have to use many 50 ft stacks of thermometers distributed evenly over the whole region, an obvious practical impossibility.
??? Based on my reading of this map in the region of northern Alaska, your “blowtorch” is my 10 deg Celsius.
If it’s so damn hot in the Arctic these days, perhaps you’d better inform the DMI that their calculations are all wrong …
Miked, “Blowtorch” was a metaphor for the anomalously high temps last week and was not meant to be taken literally.
NOTHING YOU SAY SHOULD BE TAKEN “literally“, Reggie Pooh.
And you can be sure that very few, if any, people here take ANY of your crap `literally`.