Hi Steve,
The alarmist Sydney Morning Herald have a pictorial story running of “Dramatic shrinking of Greenland glacier” “Alarming photos” compares 2009 – 2011. http://www.smh.com.au/environment/glacier/before-after
Would love to see 2013 July extent…2009-2011 seems like a handy cherry-pick.
Do you know of an aerial link that could get a looksee at 2013? Or a data source?
Cheers
The ice shelf cracked and some floated away. Happens every few years with an expanding glacier. The ice front hasn’t changed much over the last two years.
Tks for info.
SMH desperate for alarming material. They’ve reposted pictorial from 2011, without updating description: “alarming photos of the Petermann Glacier ‘a few weeks ago’,”
…right side glacier on slide 1 hasn’t changed at all from 2009-2011, if anything grown out slightly on the right side. Other slides show no glacier loss either. Alarmist SMH using melting ice blocks to scare readers. pfft
The picture is a good one of the Petermann Glacier and you can see where the floating ice tongue broke off in 2011. The rest of the fjord is still frozen.


Hi Steve,
The alarmist Sydney Morning Herald have a pictorial story running of “Dramatic shrinking of Greenland glacier” “Alarming photos” compares 2009 – 2011.
http://www.smh.com.au/environment/glacier/before-after
Would love to see 2013 July extent…2009-2011 seems like a handy cherry-pick.
Do you know of an aerial link that could get a looksee at 2013? Or a data source?
Cheers
The ice shelf cracked and some floated away. Happens every few years with an expanding glacier. The ice front hasn’t changed much over the last two years.
Tks for info.
SMH desperate for alarming material. They’ve reposted pictorial from 2011, without updating description: “alarming photos of the Petermann Glacier ‘a few weeks ago’,”
…right side glacier on slide 1 hasn’t changed at all from 2009-2011, if anything grown out slightly on the right side. Other slides show no glacier loss either. Alarmist SMH using melting ice blocks to scare readers. pfft
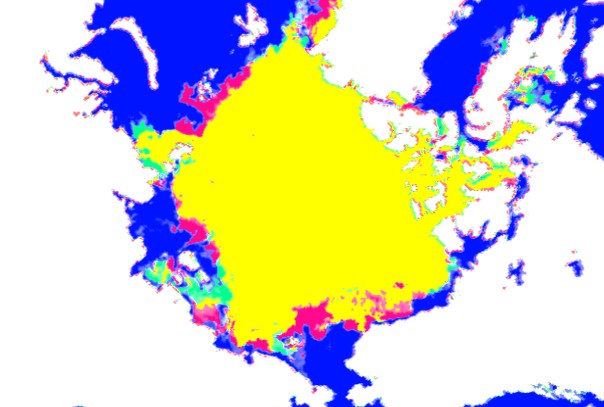
Use this link:
http://ocean.dmi.dk/arctic/images/MODIS/Kennedy/20130722AQUA.jpg
The picture is a good one of the Petermann Glacier and you can see where the floating ice tongue broke off in 2011. The rest of the fjord is still frozen.
All sorted http://stevengoddard.wordpress.com/2013/07/28/to-climate-alarmists-expanding-means-shrinking/ 🙂
Will keep for reference anyway. Cheers Billy.