COI | Centre for Ocean and Ice | Danmarks Meteorologiske Institut
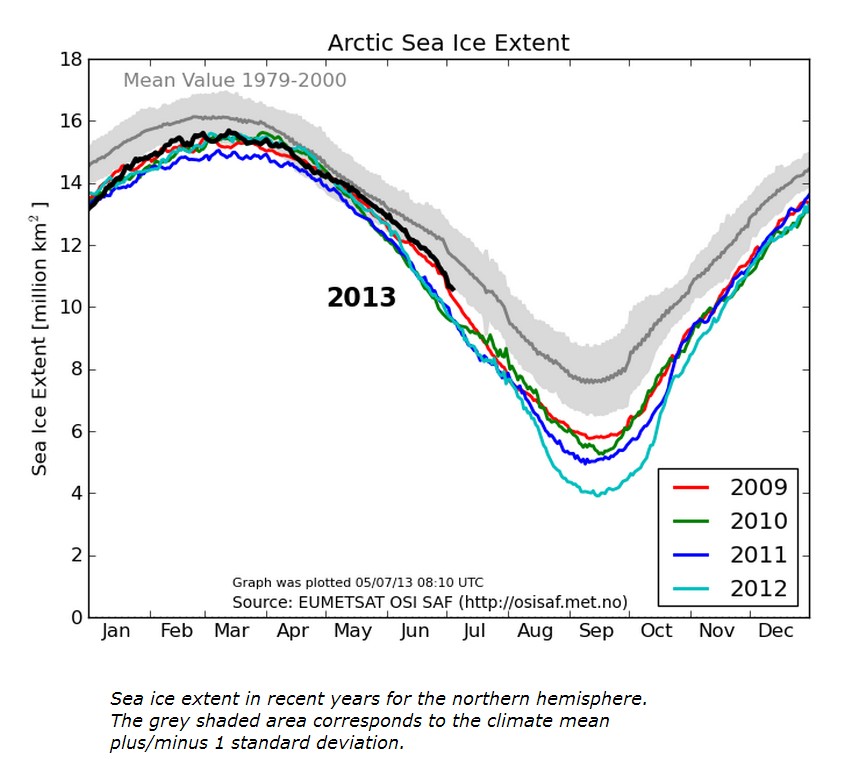
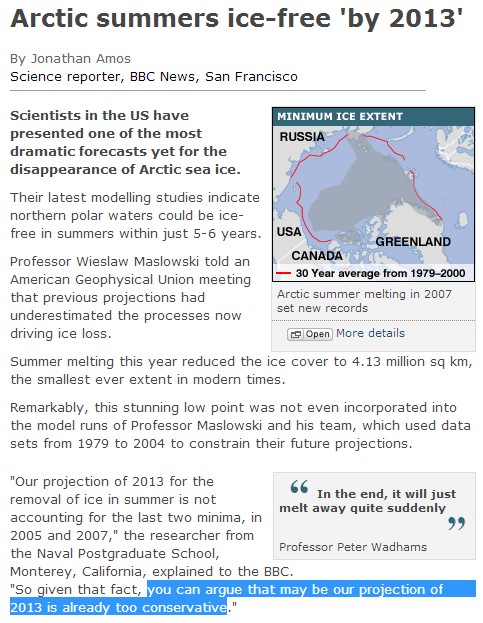
There may be more than 10 million square km of ice now, but government experts say that it will all be gone in about 60 days.
BBC NEWS | Science/Nature | Arctic summers ice-free ‘by 2013’


Horse Manure
This says otherwise
http://meteomodel.pl/klimat/arcticice_nsidc.png
So does this graph
http://meteomodel.pl/klimat/arcticice.png
OMG! The Danish government has joined the vast right wing conspiracy!
No, the graph is right, but unfortunately, as usual you are wrong.
Are you saying my two links are part of a conspiracy by 97 percent of climate scientist?
What is the gray line in the middle of the shaded gray area?
I see. You were asleep that day in your statistics class when they were discussing Gaussian distributions and standard deviation.
All you are doing is cherry picking by comparing a brief portion of this year to the four previous years.
Why don’t you ever use any REAL SCIENCE here?
ROFLMAO
You must not have read the whole post. It not only includes the entire year to date, but it also shows the official prognostication that the Arctic will be ice-free in eight weeks.
Let me get this straight, in your bizzaro world, being below the climate mean minus 1 standard deviation indicates normal ice extent.
Reggie, after you attend college and take a statistics class, please make sure and come back.
What is pathetic is the fact that your low information readers wlil look at the graph and believe your headline
Reggie, did I forget to tell you this morning that you are an idiot?
Reggie:
Real history has shown the Arctic was ice free for more than 4 a year moths as recently as 1500 years ago. 5,000 years ago ice free Arctic was normal during the summer months. Why is it you insist on Cherry Picking recent claims the Arctic being ice free is somehow unusual or will cause some major catastrophe. The Arctic scare group does not even use the claimed 30 year average as their “Normal”. However they now know that long term weather patterns that affect that region last for 40 to 80 years and they would need ten periods to begin understanding what is the “Normal” variation in the Arctic region. 600 to 800 years would give them 10 data points to begin to define what is “Normal” in that region. Until then all they can give us is WAG provided by the Nintendo Climate Models that are based on Pseudo Physics!
The Gray line in the middle of the shaded area is a construct based on 20 years of guessing what the ice conditions were, with a 70% to 85% error margin. >30=100% or >15%=100% Talk about accuracy and Cherry Picking!
Do you still believe that there is “new Ice” made from clouds at the north pole?
http://stevengoddard.wordpress.com/2013/07/02/new-ice-at-the-north-pole/
http://stevengoddard.wordpress.com/2013/07/06/arctic-hole-update/
[Reggie says : “I am now spam”]
Reggie, paid by Brawndo says:
“All you are doing is cherry picking by comparing a brief portion of this year to the four previous years.”
Reggie paid by Brawndo, We apologize but we don’t use hypothetical models to decide what the temperature is going to be next week or the month after next, or what it was 1,000 years ago, we just call the temps like they fall. We’ll leave the conjecture, what if, what could have beens, and all the chicken gut readings to you and to your alarmist pals. In the long run that is the winning combination because soon you and the other alarmists will have killed off the goose that was intended to lay the alarmist golden eggs.
Do us all a favor pal. Read President Eisenhower’s farewell speech, all of it.
Better yet here is a video of Ike giving the speech in question on 01-17-1961.
http://www.youtube.com/watch?v=CWiIYW_fBfY
Ike mentions two looming problems one is the Military Industrial complex driving defense policy to win ever larger contracts. Starting at about minute 9, the other danger that Ike mentions is the danger posed by a scientific university elite driving public policy in an effort to substitute government contracts for intellectual curiosity, because of the mounting cost of university research or the scientific communities’ love of money. Reggie, Artic sea ice wouldn’t melt in your or in the other alarmists’ mouths.
Simply throwing up a different graph doesn’t automatically refute the results shown above. (Warmist rhetorical strategy #24 – when faced with actual evidence, introduce a non sequitur argument or bring in some contrary data without going into the basis for the difference.)
In addition, there’s a link above that the reader can go to. If you follow that link, you will find some interesting remarks (in red) about why the curve is higher now than before, having to do with no longer masking out coastal areas. This could well be the reason that your graph seems to show a lower figure.
Here are two links to the sight were the alarmist were caught with their ham fisted hands in grannies’ cookie jar all the way up to their dirty elbows fudging the data Reggie Paid by Brawndo is so concerned about.
http://ocean.dmi.dk/arctic/icecover.uk.php
New
http://ocean.dmi.dk/arctic/old_icecover.uk.php
Old
I notice that Reggie has completely ignored my post in another thread where I pointed out to him that several time in this current interglacial there have been little or no summer ice cap in the Arctic yet we manage to do ok with this loss.It is in several published science papers he never read.
Such pesky inconvenient evidence must not be acknowledged by deranged warmists.
Here is that comment I made that you have ignored: http://stevengoddard.wordpress.com/2013/07/05/unprecedented-arctic-cold-continues/#comment-245984
You ignored this too:
http://stevengoddard.wordpress.com/2013/07/05/unprecedented-arctic-cold-continues/#comment-245990
Maybe because it is too hard for you to answer?
SST:
The truth is not a part of Reggie’s repertoire. 😉 Neither is learning about history.
It is routinely ignored when I bring it up in places or the rare time they answer over a paper I posted where they stupidly try to contradict what the scientist wrote.I tried it here too a while ago and man they hated it.
Heck I even QUOTED what Dr. Meier stated at Watts Up With That about it and that still does not make them wonder if that is possible.
Maybe we should post such papers in the next Arctic blog post by Steve in reply to another warmist idiot who is crying over some ice cap melting?
They are only interested in the Chicken Little Meme! Reality means nothing to them.
It looks to me like this summer is shaping up to be a complete catastrophe for Arctic alarmists.
Normal weather patterns are always a catastrophe for the alarmists! No matter what part of the sky they claim is falling.
Well, the nutters will just ‘Adjust’ the ice out of existence. They may get their ‘ice free’ arctic, if only from adjustments. But it’s going to look pretty silly when the satellite photo still shows otherwise.
A few years ago the alarmist “lost” a burning hunk of sea ice the size of California. All the papers and TV jabbering heads were crying about an ice free artic. Someone in Alaska who lived on the Artic coast called in on his satellite phone after a week of trying to get through to tell the alarmist that he found their missing sea ice, it was in his front yard all the time, hung up with a polar bear.
He convinced the scientist that the in heat sea ice went on as far as his bush plane could fly on a tank of gas. Problem solved. In the future I think that maybe the alarmist should spay or neuter their sea ice so that the sea ice won’t wonder off again in search of a little action. 😆
Probably this has been discussed on your site before, but why is the mean calculated from 1979-2000? Why not also more recent data? Starting with 1979 is bad enough, it being a spike year in Arctic ice extent.
Cherries my friend! I have the asked same question for nearly a decade now. We have data before 1979 and obviously we have continued to collect data past the year 2000. We also know climate cycles run in many differing lengths. The ONLY explanation is that the alarmists know if they include ALL data, what we will see is perfectly unremarkable.
I have contacted the powers that be and was told they are ‘considering’ using a larger data set someday, maybe.
Steve has posted in the past the 1970’s data along with the 1979-2013 data to show that 1979 was a peak year thus making a downward slope so significant to make it appear a catastrophic meltdown is happening.When actually lower levels of ice cover was more common.