Arctic ice area has grown by 21,000 Manhattans since last year, the largest increase on record.
Disrupting the Borg is expensive and time consuming!
Google Search
-
Recent Posts
- “Gell-Mann Amnesia effect”
- Socialism Couldn’t Save The Glaciers
- Record Slow Ice Melt
- “I’m from the Government, and I’m here to help”
- Latest Research In Climate Science
- UK Sucking Carbon
- Price-Free Tesla
- Four Years Past The Deadline
- Cooling Minnesota
- UK Net Zero
- Erasing 1921
- “the world’s most eminent climate scientists”
- Warming Toledo
- One Year Left To Save The Planet
- Cold Hurricanes
- Plant Food
- President Trump Gets Every Question Right
- The Inflation Reduction Act
- Saving The Ecosystem
- Two Weeks Past The End Of The World
- Desperate State Of The Cryosphere
- “most secure in American history”
- “Trump moves to hobble major US climate change study”
- April 11, 1965 Tornado Outbreak
- The CO2 Endangerment Finding
Recent Comments
- Robertvd on Record Slow Ice Melt
- Stewartpid on Socialism Couldn’t Save The Glaciers
- gordon vigurs on “I’m from the Government, and I’m here to help”
- Bob G on “I’m from the Government, and I’m here to help”
- Bob G on Socialism Couldn’t Save The Glaciers
- Bob G on Record Slow Ice Melt
- gordon vigurs on “I’m from the Government, and I’m here to help”
- gordon vigurs on Four Years Past The Deadline
- conrad ziefle on Latest Research In Climate Science
- Gamecock on “I’m from the Government, and I’m here to help”
Children just aren’t going to know what global warming panic was all about.
Where’s the crisis? Where’s the beef?
Reblogged this on CraigM350.
Reblogged this on Health Science Watch.
Steven,
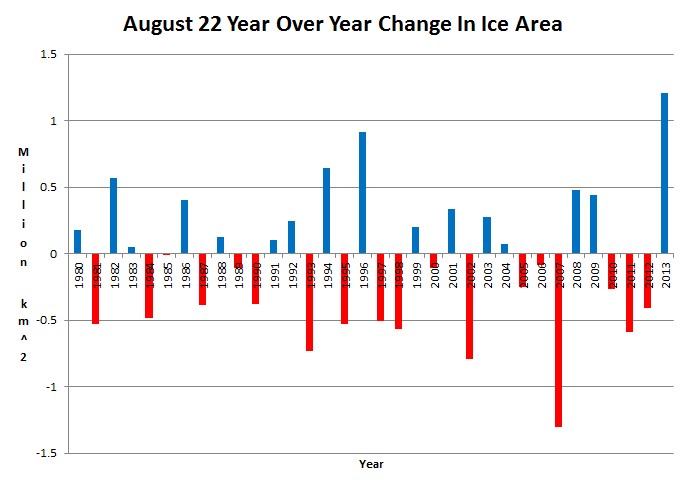
My father has asked me to explain how this graph was made from the data at that link. Can you provide some info so that I can explain it to him? I realize the first column is the date in a strange format, 2nd column is difference between 3rd and 4th columns. Not sure what the 3rd column is, assuming 4th column is Ice Area, but how do you create the graph from this data. Many thanks in advance,
Terry
Date, Anomaly, Area, Mean Area For 1979-2000