COI | Centre for Ocean and Ice | Danmarks Meteorologiske Institut
Disrupting the Borg is expensive and time consuming!
Google Search
-
Recent Posts
- Gaslighting 1924
- “Why Do You Resist?”
- Climate Attribution Model
- Fact Checking NASA
- Fact Checking Grok
- Fact Checking The New York Times
- New Visitech Features
- Ice-Free Arctic By 2014
- Debt-Free US Treasury Forecast
- Analyzing Big City Crime (Part 2)
- Analyzing Big City Crime
- UK Migration Caused By Global Warming
- Climate Attribution In Greece
- “Brown: ’50 days to save world'”
- The Catastrophic Influence of Bovine Methane Emissions on Extraterrestrial Climate Patterns
- Posting On X
- Seventeen Years Of Fun
- The Importance Of Good Tools
- Temperature Shifts At Blue Hill, MA
- CO2²
- Time Of Observation Bias
- Climate Scamming For Profit
- Climate Scamming For Profit
- Back To The Future
- “records going back to 1961”
Recent Comments
- conrad ziefle on Gaslighting 1924
- arn on Gaslighting 1924
- Gordon Vigurs on Gaslighting 1924
- Bob G on Climate Attribution Model
- conrad ziefle on Climate Attribution Model
- Ohio Cyclist on Climate Attribution Model
- Bob G on Climate Attribution Model
- Bob G on Climate Attribution Model
- Bob G on Fact Checking NASA
- arn on Climate Attribution Model


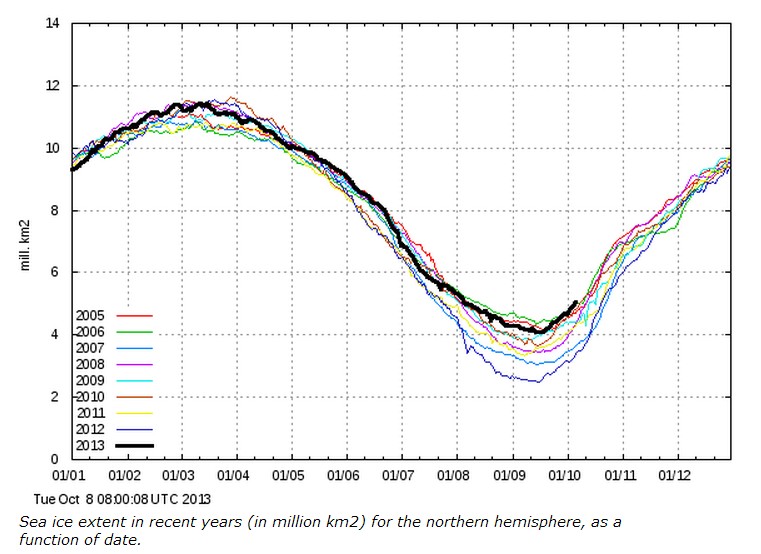
The IARC-JAXA ice extent figures are rapidly approaching those of 2006, in both the v1 and v2 datasets.
Hi QV
Yup closing in on 2006 also v2 went higher than 2005 today and v1 has been higher than 2005 for the last week. So at present 2013 is higher than 7 out of the last 8 years, interesting!
From the graph it looks like we clearly have more ice than 2006, more ice than all the last 8 years. Is the graph not the final word, or what?
“From the graph it looks like we clearly have more ice than 2006..”
Yup, it sure does, I missed that it was 30% concentration Ice Extent . Data I was referring to was 15% concentration. Obviously my concentration was even lower:-)
Look at that sucker climb.
Quote from UNIPCC: “it’s not working!!!!”
Latest Reaction from Alarmists to record ice extent
http://youtu.be/ZR6wok7g7do
Does anybody have a link for earlier years, 2004, 2003, etc. How far back do we go to find a year with more ice than current levels?