
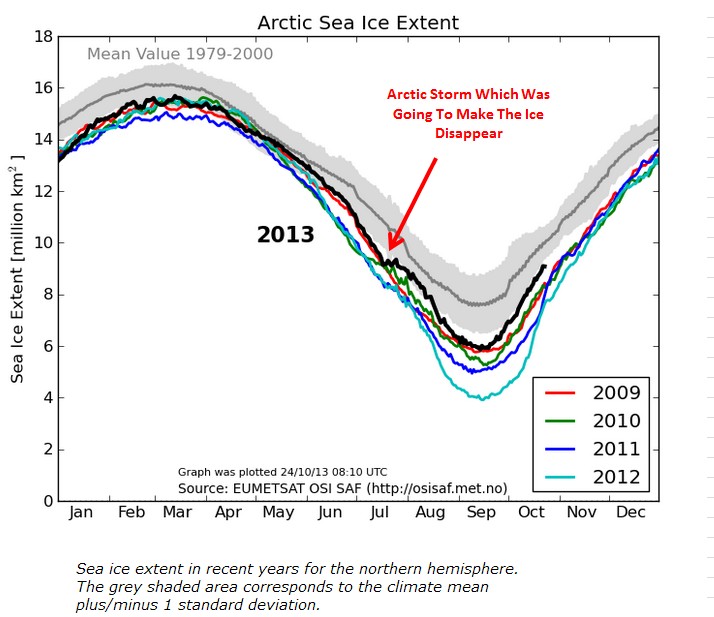
A cyclonic storm hit the Arctic in July, and NSIDC told us that it was going to make the ice disappear, due to a whole new set of rules.
COI | Centre for Ocean and Ice | Danmarks Meteorologiske Institut
A cyclonic storm hit the Arctic in July, and NSIDC told us that it was going to make the ice disappear, due to a whole new set of rules.
COI | Centre for Ocean and Ice | Danmarks Meteorologiske Institut

Whose rules? Mother Nature’s, or NSIDC graphics?
I always find it curious that the mean Arctic temperature mean ±1SD is based on data from 1979—2000, and does not include 2001–2012 data. Reason? The curve for Arctic ice for 2013 lies just to the lower edge of the 1979–2000 mean ±1SD. Because 2001–2012 Arctic ice melts lie well below the 1979–2000 mean ±1SD, reanalysis could prove very interesting if these data were included or used as a basis for comparison.
So— 1) (this is the one I’d love to see) if 2013 were compared to the 2001–2012 mean ±1SD data set, where would it lie in that analysis? I’d bet it would lie at the very UPPER edge of the ±1SD, i.e., the 2013 data would NOT be a part of the 2001–2012 data set. This would not a good finding for the CAGW folks, because it would clearly imply that the Arctic ice is not only NOT disappearing, but that the Arctic might be growing colder, with all that implies. One more nail in the coffin of CAGW, and of course they can’t have that.
On the other hand, 2) if the comparative mean ±1SD included ALL data from 1979–2012, the mean would drop compared to the 1979–2000 data set. If so, it’s very likely that the 2013 curve would not only lie well within the ±1SD of that mean but possibly lie well ABOVE the mean itself. Again, not good news for the CAGW folks.
Bottom line: Never mind CAGW; Global Cooling, anyone? For that, we’ll just have to wait and see.
Great site, Steve!
Notice how the change in solar radiations since 2008, and consequent changes in the NH ice anomaly, was already pointing toward the present recovery of Arctic ice,
http://arctic.atmos.uiuc.edu/cryosphere/IMAGES/seaice.anomaly.arctic.png
The trend of the maximums of the ice anomaly changed since that year to become very close to the mean of 1979-2000 (indicating a stabilization of the temperatures of the NP), while prior to 2008 the trend was for decreasing maximums *and* minimums (indicating warming),
If the pattern defined this year continues, we’ll have *both maximums and minimums* going up in the years ahead.
This change of trends related with solar radiations clearly indicates a progressive cooling of the N. Pole, IMO, at least with respect to the conditions at the end of last century.
… because cycle C24 is starting to decline, I’m confident that the cooling of the Arctic (and of course of the Antarctic continent too) will continue and most probably accelerate.
OT
Steven
Notrickzone ( http://notrickszone.com/ ) has a brilliant piece on McKibben. The picture of him that they use seems to cast the ‘evil doctor’ look on him, and it’s Creative Commons Attribution-Share Alike 2.0 Generic license.
Experts like this are rare. They should be hired to fix OBamBam’s website.
The proper term is ice-changiness or ice-weirding.
Looks like 2013 is kicking b@tt! What is it going to take for the shameless fear mongering Chicken Littles to have their rears kicked? Well, these things: soon the day will come where the 1979-2000 avg is being kicked, and Antarctic ice will be at record levels (wait, that’s already the case!!!), and temperatures will start to not just flatline but drop, and the evidence will become clear that the 1930s was hotter than today, and Drudge will highlight this key must see (and share) video on CO2, a quick and effective debunking of the main warmist claim:
http://www.youtube.com/watch?v=WK_WyvfcJyg&GGWSwindle_CO2Lag
Interesting that the ice seemed to take a step up after that storm, and has stayed there ever since.
You’re going to get complaints that you excluded the blow torch in this graph?
Steve, have you seen this? They’ll never give up.
http://www.cbc.ca/news/technology/eastern-arctic-temperatures-likely-at-120-000-year-high-1.2251709
From that article —
Melting ice caps on Baffin Island have exposed evidence suggesting that average summertime temperatures in the Eastern Canadian Arctic are higher than they’ve been since the beginning of the last ice age 120,000 years ago.
The study shows current temperatures are “well outside the range of natural variability now,” said Gifford Miller, from the University of Colorado, Boulder, who led the study, in an interview with CBC News Friday.
“And so… there’s really nothing left but greenhouse gases to explain why the warming is occurring.”
Previously, some scientists thought it was possible that current Arctic warming might be within the range of natural variability, and that the Arctic may in fact have been warmer than it is now during the Early Holocene, shortly after the end of the last ice age 11,700 ago. At that time variations in the Earth’s orbit meant the amount of solar energy reaching the Northern Hemisphere was about nine per cent higher than it is now, leading to a 5,000-year warm period that peaked around 6,000 to 8,000 years ago, Miller said.
However, the analysis by Miller and his colleagues suggests that average temperatures never got as high as they are now in the area of Baffin Island that they studied. The study was published this week in the journal Geophysical Research Letter
The researchers gathered dead moss that had been exposed by melting of the ice caps, and used radiocarbon dating in an effort to find out how long the moss had been buried in the ice before that. Radiocarbon dating can only be used to determine when an organism had been alive within the past 50,000 years. In the case of the moss, the researchers hit the 50,000-year limit, which meant that the moss had been buried since the middle of the last ice age. And since the ice almost certainly didn’t melt during the ice age, it had probably been there since the beginning of the ice age, 120,000 years ago.
Miller said he and his colleagues had specifically chosen a flat area for their study so that any ice loss would have to be due to melting and not erosion. The researchers were also able to calculate maximum thickness of the ice based on the local topography. With that information, they calculated that had it been as warm at any point during the Early Holocene as it is today, within 100 years, the ice would have melted enough to expose the moss. The fact that this never happened suggested that it never got that warm.
Ice core evidence
In fact, evidence from ice cores collected in nearby Greenland suggest that summer temperatures in the region haven’t been as warm as they are now for 120,000 years.
Another interesting finding of the new study was that from 5,000 to 500 years ago, average summer temperatures in the region cooled about 2.7 C — about double what most climate models show.
Miller said that suggests the models may underestimate the huge temperature swings in the Arctic relative to other parts of the world when the average global temperature changes. The Arctic is thought to respond more strongly because effects of warming are amplified by the large-scale melting of Arctic ice in forms such as sea ice and ice caps.
“Maybe the future warming estimates for the Arctic are still underestimated,” Miller added.
Eastern Arctic temperatures likely at 120,000-year high – Technology & Science – CBC News
“…11,700 ago. At that time variations in the Earth’s orbit meant the amount of solar energy reaching the Northern Hemisphere was about nine per cent higher than it is now…”
9% higher incident solar energy could only have been due to about a 4.5% smaller mean solar distance than today’s 93 million miles, or about 4 million miles closer to the Sun. There is no way to change the mean orbital radius by 4 million miles (and in only 11,700 years at that–that’s 345 miles a year, somebody alert the media). The yearly variation today is only 1.55 million miles to either side of 93 million, and any variation in the mean radius would have to be a very, very small fraction of that (unless earth science has embraced a “Worlds In Collision” scenario). And ask yourself, since the Earth’s orbit is so nearly circular now, how could that neat circularity have come about, from a 4.5% change in the mean orbital radius? Why should the orbit be so close to circular just now, in our time–simple probability should tell us it has almost certainly been thus since the “beginning”. Milankovitch theory is obviously just another false theory.
So the dating failed, and they just assumed the oldest date they could get away with.
OK.
Between “Miller and colleagues” and the observed facts I’ll stay with the *facts*, that prove that the Arctic is cooling (after 2008).
Shock News: Antarctic Ice extent at record. Guy Williams, “sea ice specialist”, says that doesn’t matter as there is a “nett decline globally”. Either he is blind or a liar.
http://m.theaustralian.com.au/national-affairs/policy/record-winter-ice-cover-in-antarctica/story-e6frg6xf-1226745602870
The obvious question – in keeping with the overall meme – is:
http://www.youtube.com/watch?v=IIN5ZEkvNuc