
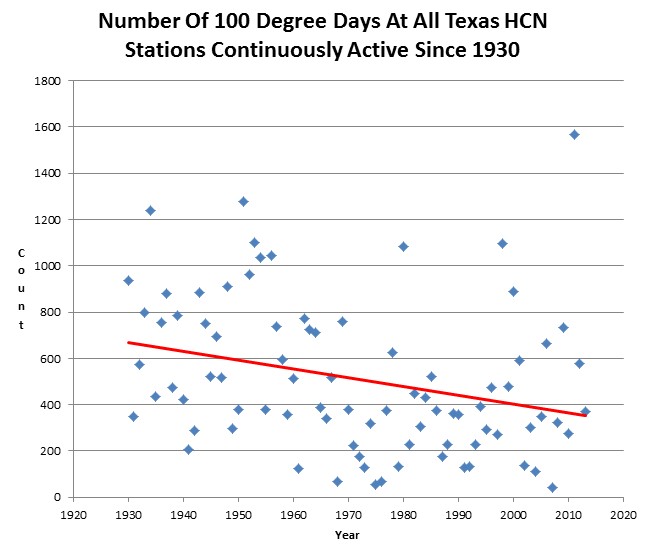
Texas summer afternoons have been getting much cooler since 1930, with 100ºF days down 40%.
Index of /pub/data/ghcn/daily/hcn/
Here in West Texas we’re already really dry… so drought is almost the norm for us. But with climate change, what we see is through increasing temperatures and through increasing variability in our precipitation rainfall patterns, we have the potential for even more impacts on water in the future … It’s as if we have two dice and we always have a chance of rolling that double six, which would be that extreme event. But with many of our events – including very high temperature days, extreme heat, and heavy rainfall – climate change has been kind of coming in and removing some of those other numbers off the dice and putting in more sixes … increasing our risk of having one of those [extreme] events.
Climate Change and the Drought: An Interview With Katharine Hayhoe | StateImpact Texas

Hayhoe, Hayhoe, it’s off to spread mindless superstition we go …
[youtube=http://www.youtube.com/watch?v=whnn9ReUV04]
Station name	 State	 Station Number
ALBANY                             	 TX	 USC00410120
ALPINE                             	 TX	 USC00410174
BALLINGER 2 NW                     	 TX	 USC00410493
BALMORHEA                          	 TX	 USC00410498
BEEVILLE 5 NE                      	 TX	 USC00410639
BLANCO                             	 TX	 USC00410832
BOERNE                             	 TX	 USC00410902
BRENHAM                            	 TX	 USC00411048
BROWNWOOD 2ENE                     	 TX	 USC00411138
CORSICANA                          	 TX	 USC00412019
CROSBYTON                          	 TX	 USC00412121
DANEVANG 1 W                       	 TX	 USC00412266
EAGLE PASS 3N                      	 TX	 USC00412679
ENCINAL                            	 TX	 USC00412906
FALFURRIAS                         	 TX	 USC00413063
FLATONIA 4SE                       	 TX	 USC00413183
GREENVILLE KGVL RADIO              	 TX	 USC00413734
HALLETTSVILLE 2 N                  	 TX	 USC00413873
HASKELL                            	 TX	 USC00413992
LAMPASAS                           	 TX	 USC00415018
LIBERTY                            	 TX	 USC00415196
LLANO                              	 TX	 USC00415272
LULING                             	 TX	 USC00415429
MARSHALL                           	 TX	 USC00415618
MEXIA                              	 TX	 USC00415869
MIAMI                              	 TX	 USC00415875
MULESHOE #1                        	 TX	 USC00416135
NEW BRAUNFELS                      	 TX	 USC00416276
PARIS                              	 TX	 USC00416794
PLAINVIEW                          	 TX	 USC00417079
QUANAH 2 SW                        	 TX	 USC00417336
RIO GRANDE CITY                    	 TX	 USC00417622
SEMINOLE                           	 TX	 USC00418201
SNYDER                             	 TX	 USC00418433
STRATFORD                          	 TX	 USC00418692
WEATHERFORD                        	 TX	 USC00419532

http://www.katharinehayhoe.com/bio.php
worth the read to see where she’s coming from.
Guess critical thinking is no longer required to get PhDs.
Parrots have Degrees.
hayhoe has a Hole in her head. I grew up in the Dallas/Fort Worth aera and the Trinity river was always up and down over the years.
Heck back in 1904 it was 6 times lower than today and set a record:
http://tinyurl.com/kdg7nub
The summer afternoons may be getting cooler but when they are hot it’s the wrong kind of heat. Brits would understand.
Most claims that the IPCC models have failed are based on surface temperature changes over the past 15 years (1998–2012). During that period, temperatures have risen about 50 percent more slowly than the multi-model average, but have remained within the range of individual model simulation runs.
However, 1998 represented an abnormally hot year at the Earth’s surface due to one of the strongest El Niño events of the 20th century. Thus it represents a poor choice of a starting date to analyze the surface warming trend (selectively choosing convenient start and/or end points is also known as ‘cherry picking’). For example, we can select a different 15-year period, 1992–2006, and find a surface warming trend nearly 50 percent faster than the multi-model average.
Global surface temperature data 1975–2012 from NASA with a linear trend (black), with trends for 1992–2006 (red) and 1998–2012 (blue).
In short, if David Rose wasn’t declaring that global surface warming was accelerating out of control in 2006, then he has no business declaring that global surface warming has ‘paused’ in 2013. Both statements are equally wrong, based on cherry picking noisy short-term data.
Leftist are nothing if not duplicitous. 😆
So it is wrong to use an abnormally warm start date (1998), but good to use an abnormally cold start date (1975). Got it!
ROFLMAO!!!
The starting date I always see is 1900.
You did not mention 1900 anywhere in your comment. And from your reply it is apparent that you simply parrot what you see and hear. You do not have the capacity for original thought.
Here is the spaghetti graph comparing model temperature “projections” versus the actual temp data: http://wattsupwiththat.files.wordpress.com/2013/06/cmip5-73-models-vs-obs-20n-20s-mt-5-yr-means11.png
Avery, you say, “During that period, temperatures have risen about 50 percent more slowly than the multi-model average,”
I just checked. When you say “risen about 50 percent more slowly”, do you mean “cooled”?
http://woodfortrees.org/plot/hadcrut3vgl/from:1998/to:2012/plot/hadcrut3vgl/from:1998/to:2012/trend
2000 to 2010 was warmer than 1990 to 2000. The rate of surface warming may have been less but warming continued. It is suspected that the rate of warming did not slow but was transferred to the ocean. The warming mechanism did not change. Air temperatures may not be the best judge of what is going on.
and 1850 was the end of the LIttle Ice Age…..what’s your point?
2011 sucked ass.
What about the temperature overnight? Just wondering how much it has increased as cities get larger and larger that is creating UHI. It has been a while since we got single digit temperature deep into Texas which was in 1980s. I remember it very fondly when I lived in Houston… frozen outdoor fish pond that you could walk on…