Chapter 2 IPCC WGI Fifth Assessment Report
Substantial losses in Arctic sea ice have been observed
since satellite records began, particularly at the time of the mimimum extent, which occurs in September at the end of the annual melt season. By contrast, the increase in Antarctic sea ice has been smaller.
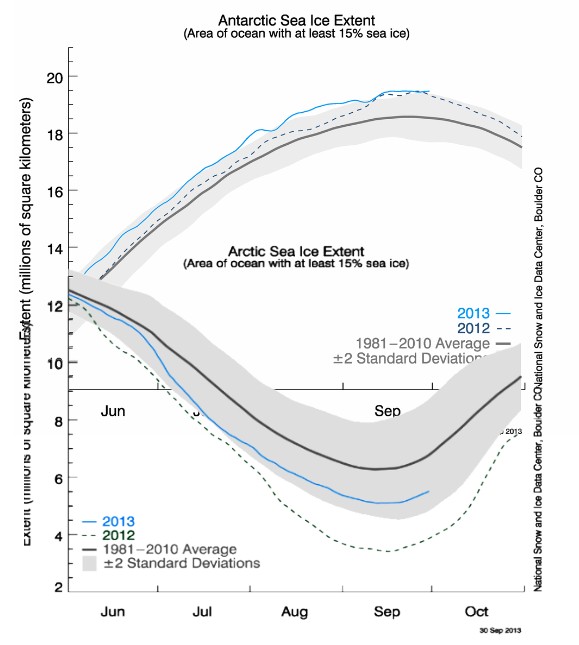
Let’s have a look at that claim – which they published this week. Southern Hemisphere sea ice is one million km² above normal, and Northern Hemisphere sea ice is one million km² below normal. For most people who have completed first grade, one minus one equals zero. But not for the world’s top climate scientists, who apparently also don’t know how to use a spell checker.


Reblogged this on The Firewall.
Maybe this is what they meant
http://www.youtube.com/watch?v=D2Oybvszv8k
this could be the MIMIMUM
http://www.youtube.com/watch?v=gahOqE-sIx0
There are 3 elephants in the room –
There is a huge volume of ice that is locked up on the continent of Antarctica – far more than Greenland – differences range from 10 times more – US geological Survey – to 12 times more -virtually everybody else.
The sea ice MINIMUM around Antarctica is almost always greater than the Arctic MAXIMUM.
The Gulf Stream – the Atlantic narrows as you approach the Arctic concentrating warm water – there is no such similar phenomenon in the Southern Ocean.
I smell something even fishier going on here…
http://stevengoddard.wordpress.com/2013/10/02/ipcc-if-the-data-doesnt-fit-the-theory-change-the-data/
(the part about to hemispheres weather being tied together)
probably covering there asses for the inevitable lack of sea level rise.