Disrupting the Borg is expensive and time consuming!
Google Search
-
Recent Posts
- “Why Do You Resist?”
- Climate Attribution Model
- Fact Checking NASA
- Fact Checking Grok
- Fact Checking The New York Times
- New Visitech Features
- Ice-Free Arctic By 2014
- Debt-Free US Treasury Forecast
- Analyzing Big City Crime (Part 2)
- Analyzing Big City Crime
- UK Migration Caused By Global Warming
- Climate Attribution In Greece
- “Brown: ’50 days to save world'”
- The Catastrophic Influence of Bovine Methane Emissions on Extraterrestrial Climate Patterns
- Posting On X
- Seventeen Years Of Fun
- The Importance Of Good Tools
- Temperature Shifts At Blue Hill, MA
- CO2²
- Time Of Observation Bias
- Climate Scamming For Profit
- Climate Scamming For Profit
- Back To The Future
- “records going back to 1961”
- Analyzing Rainfall At Asheville
Recent Comments
- arn on Climate Attribution Model
- Bob G on Climate Attribution Model
- Bob G on Climate Attribution Model
- Bob G on Climate Attribution Model
- Bob G on Climate Attribution Model
- John Francis on Ice-Free Arctic By 2014
- Bob G on Climate Attribution Model
- Bob G on Climate Attribution Model
- Bob G on Climate Attribution Model
- Robertvd on “Why Do You Resist?”
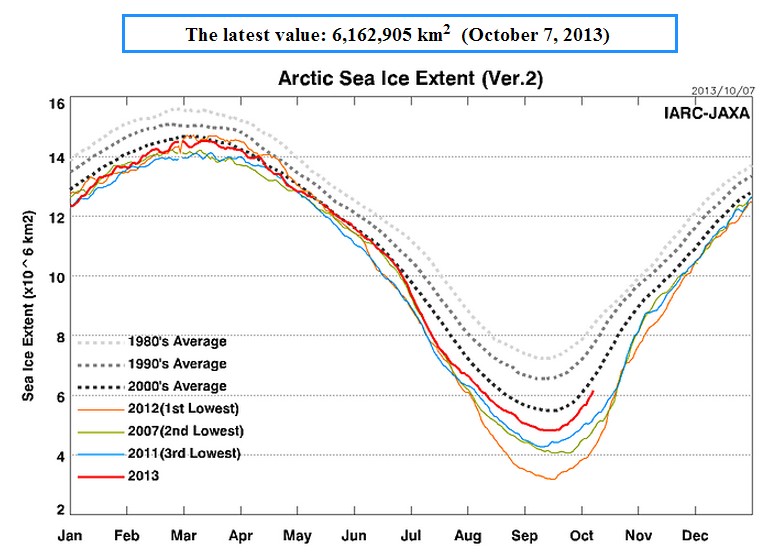
What Part Of This Graph Is The IPCC Not Able To See?
This entry was posted in Uncategorized. Bookmark the permalink.


IPCC never looked at the graph. They don’t care about charts that dispute their motive. They only care about creating charts to promote it.
That’s a pretty impressive increase in ice since the minima, putting on the pounds more than me at Christmas. I actually thought it would be flatter than that.
It could reduce ice thickness by spring though. The large extent means snowfall on top of it before things get really cold will insulate it against the cold to some extent so ice thickness is lower than normal. Conversely after 2007 the scientists discovered it put on thickness more than they expected.
Andy
Answer: All of it . They cannot fit it into their World View and so it is of no use to them!