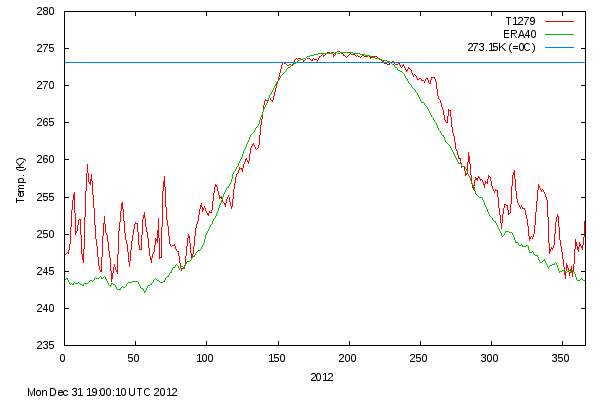
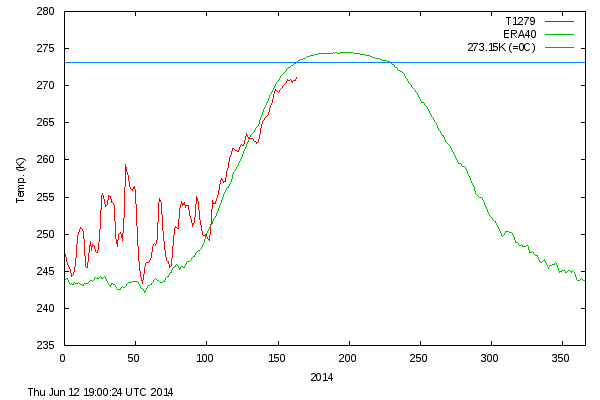
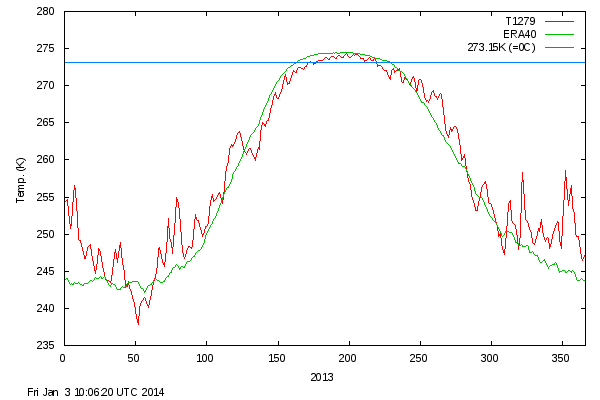
Summer temperatures at the North Pole have been persistently below normal for almost two years. The last summer day which reached the mean was in August, 2012. Every summer day in 2013 and 2014 has had below normal temperatures, with this year running far below normal.

COI | Centre for Ocean and Ice | Danmarks Meteorologiske Institut


If the current trend continues (based on Figure 1), this year will be significantly colder in the Arctic than the last. Note, too, that the “Polar Vortices” were supposed to have pulled all the cold air out of the Arctic. Data so far don’t show that at all.
Now, where is my winter parka…
“Because the magfield is weak at the poles, the cold in Outer Space leaks in too easily. Ship some big magnets up there, quick! But be sure to point them the right way.”
Brrrrr
Interesting.
I remember that chart from last year as being even more below normal than what you are showing. I remember it because I was trying to figure out how many days shorter the melt season was yet your current chart does not show the melt season as being shorter. HMMmmmm
It was shorter Gail, because the red line became below the 273 K before the green one, therefore technically before the “normal” (average) end of the summer.
But here it all looks normal or even a bit too warm.
http://polar.ncep.noaa.gov/sst/ophi/color_anomaly_NPS_ophi0.png
Let’s see .Who is the owner of this map? noaa.gov.
So normal sst cools the air above it.
I love that map. All that ocean with a SST of 4 deg C looks like it’s boiling because it is red! And because there is almost no open ocean across the arctic basin, that has to be zero. Even though it is covered in ice. NOAA are worse that CSIRO right now and need a savage budget cut and an alarmist clean out.