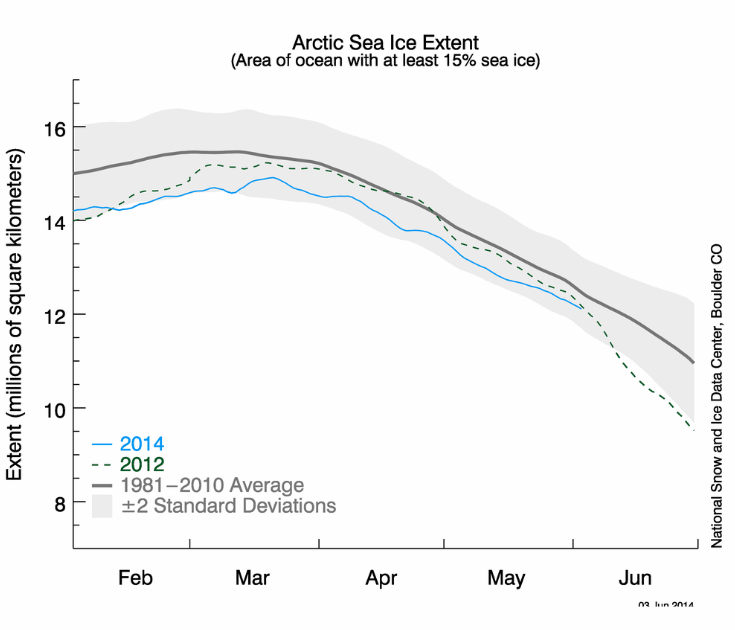
2012 was the last holy year for alarmists, with record winter warmth in the US and record low summer Arctic ice extent. Arctic ice extent is currently less than it was on the same date in 2012, and will probably remain that way for a few more hours.
Disrupting the Borg is expensive and time consuming!
Google Search
-
Recent Posts
- Gaslighting 1924
- “Why Do You Resist?”
- Climate Attribution Model
- Fact Checking NASA
- Fact Checking Grok
- Fact Checking The New York Times
- New Visitech Features
- Ice-Free Arctic By 2014
- Debt-Free US Treasury Forecast
- Analyzing Big City Crime (Part 2)
- Analyzing Big City Crime
- UK Migration Caused By Global Warming
- Climate Attribution In Greece
- “Brown: ’50 days to save world'”
- The Catastrophic Influence of Bovine Methane Emissions on Extraterrestrial Climate Patterns
- Posting On X
- Seventeen Years Of Fun
- The Importance Of Good Tools
- Temperature Shifts At Blue Hill, MA
- CO2²
- Time Of Observation Bias
- Climate Scamming For Profit
- Climate Scamming For Profit
- Back To The Future
- “records going back to 1961”
Recent Comments
- Bob G on Gaslighting 1924
- Bob G on Gaslighting 1924
- conrad ziefle on Gaslighting 1924
- Bob G on Gaslighting 1924
- Bob G on Gaslighting 1924
- arn on Gaslighting 1924
- conrad ziefle on Gaslighting 1924
- Gordon Vigurs on Gaslighting 1924
- conrad ziefle on Gaslighting 1924
- Robertvd on Gaslighting 1924


Well, if the sea ice is so few and we’re finally having the proof of all the alarmist’s claims, then where are the rising sea levels?
Sea ice has no effect on sea level.
The Holocene sealevel Highstand was ~ 1.5 meter above todays sea-level 6,000 years ago in geologically stable South Vietnam. Sea level has been DECREASING in fits and starts ever since then.
The paper, Temperature and precipitation history of the Arctic> says: “Solar energy reached a summer maximum (9% higher than at present) ~11 ka ago and has been decreasing since then, primarily in response to the precession of the equinoxes. The extra energy elevated early Holocene summer temperatures throughout the Arctic 1-3°C above 20th century averages, enough to completely melt many small glaciers throughout the Arctic, although the Greenland Ice Sheet was only slightly smaller than at present.”
Another, more recent study in Norway agrees:
The authors of all these papers simply state that most small glaciers likely didn’t exist 6,000 years ago, but the highest period of the glacial increase has been in the past 600 years. This is hardly surprising with ~9% less solar energy.
9% less solar energy translates to ~120 W/m² less solar energy based on 1,361 W/m² (solar min) and 1362 W/m² (solar max) @ ToA.
The Intergovernmental Panel on Climate Change [Schimel, 1996] estimated that the change solar forcing between 1850 (start of the industrial age] and 1990 was only •0.3 W/m 2 at the top of the atmosphere vs. 1.5 W/m 2 for forcing anthropogenic CO2 [cf., Reid, 1997].
So even if you are talking 9% of Trenbreth’s “incoming solar radiation… absolute forcing,… around 340 W m–2 at the top of the atmosphere” the reduction in solar radiation since the Holocene climate Optimum is 30.6 W m–2 , around 11,000 years ago and is close to equivalent to the entire CO2 forcing [32-44 W m–2] with mankind’s contribution being 1.5 W/m 2 for the forcing of anthropogenic CO2 [cf., Reid, 1997].
Can you see how completely nonsensical the whole scam is once you look at the entire Holocene?
(I really hate the word ‘Forcing’ since CO2 is only retarding out-going radiation if that.)
Nice post Gail, thanks.
I’m completely skeptical about CO2 as an important GHG, I believe it’s direct influence is at the level of statistical noise.
OTOH it could have an effect on atmospheric dryness, through enhanced retention of water by plants,
http://wattsupwiththat.com/2011/03/04/negative-water-vapor-feedback-in-plant-evapotranspiration-found/
You also need to look at the above 80N temperatures
http://ocean.dmi.dk/arctic/meant80n.uk.php
This year looks like being another very short period above freezing.
The real question is will high-Arctic temperatures even make it above freezing this summer, based on the trend in that graph.
Will be interesting if it makes it above thirty year average, then both poles will be above average which is unusual. Although site has slight bias, crossing of thirty year average will get their attention. Build up of multi year ice is well noted
Arctic sea ice means nothing. This winter all the cold from the arctic came down to north america and the Great Lakes region during about 4 or 5 arctic blasts of high pressure (erroneously called polar vortex). It doesn’t mean the pole is getting warmer, it means the cold moved to the Great Lakes, drawing warm air up to the pole from Asia. No cause for alarm.
I know alarmists like to define what ‘average’ is, but never in my life was I able to determine an average by eliminating two years, or more, of data.
The great difference is the rate of melting.
DMI
http://ocean.dmi.dk/arctic/plots/icecover/icecover_current_new.png
and NORSEX
http://arctic-roos.org/observations/satellite-data/sea-ice/observation_images/ssmi1_ice_ext.png
show a very stable rate in the last ~ 2 months and only 2009 and 2013 are above 2014 now.
DMI also shows the NP temperatures as low as in 2013, but I’d not be surprised if this season ended up even cooler than last year. The great unknown is the intensity of solar radiations, which seem to have a direct effect on the NP temps and Arctic ice.
Hard to make predictions in times of 2nd peak.
If the present rate continues the Arctic ice should surpass 2009 and 2013 extents at the end of this month or begin of July.
If you take the maximum in March/2014, in the above NSIDC graph, and draw a straight line to the present extent you’ll get a reasonable average of the entire period (~ 2 1/2 months)