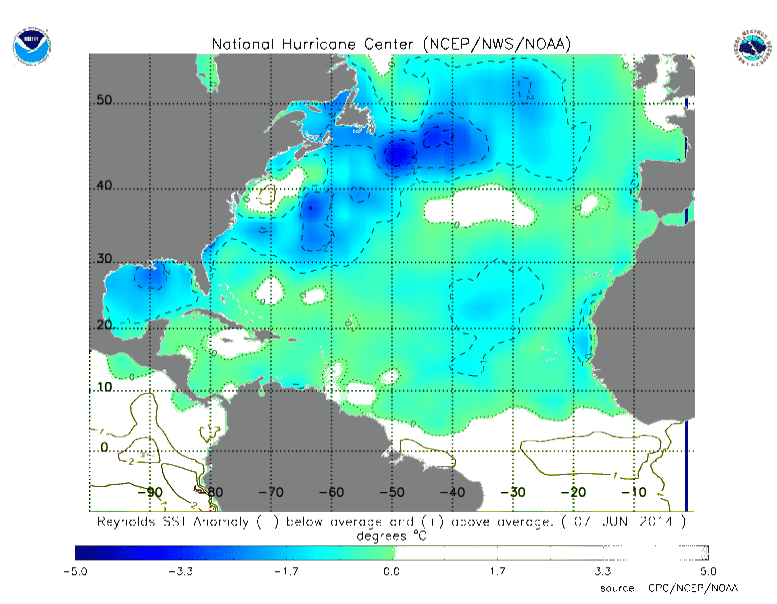
I masked off all above normal temperatures in the North Atlantic as white, and you can see that more than 90% of the region above 10N is below normal temperature. Kevin Trenberth says that the small warm spot near New Jersey is caused by global warming.
Disrupting the Borg is expensive and time consuming!
Google Search
-
Recent Posts
- Gaslighting 1924
- “Why Do You Resist?”
- Climate Attribution Model
- Fact Checking NASA
- Fact Checking Grok
- Fact Checking The New York Times
- New Visitech Features
- Ice-Free Arctic By 2014
- Debt-Free US Treasury Forecast
- Analyzing Big City Crime (Part 2)
- Analyzing Big City Crime
- UK Migration Caused By Global Warming
- Climate Attribution In Greece
- “Brown: ’50 days to save world'”
- The Catastrophic Influence of Bovine Methane Emissions on Extraterrestrial Climate Patterns
- Posting On X
- Seventeen Years Of Fun
- The Importance Of Good Tools
- Temperature Shifts At Blue Hill, MA
- CO2²
- Time Of Observation Bias
- Climate Scamming For Profit
- Climate Scamming For Profit
- Back To The Future
- “records going back to 1961”
Recent Comments
- Bob G on Gaslighting 1924
- Bob G on Gaslighting 1924
- conrad ziefle on Gaslighting 1924
- Bob G on Gaslighting 1924
- Bob G on Gaslighting 1924
- arn on Gaslighting 1924
- conrad ziefle on Gaslighting 1924
- Gordon Vigurs on Gaslighting 1924
- conrad ziefle on Gaslighting 1924
- Robertvd on Gaslighting 1924


Hi Steven
seeing you’re good at working with image data, I have a request.
We’re working on a new base for our climate that will effectively reduce the greenhouse effect to ~0K.
I need the surface area in square kilometres of our oceans, where the surface temperature is below respectively 277K, 276K and 275K.
If you’re able and willing to help, please contact me by email.
regards
Ben Wouters
Sea temperatures are becoming the narrative of choice to ‘explain’ the missing heat to a poorly-informed public. ‘93%’ of energy goes into the sea, the Guardian claimed yesterday. Sounds scary, which is the whole point.
Alarmists can’t easily claim catastrophic surface warming when everyone can see and feel it’s simply not happening – but it’s kind-of tricky for Joe Public to challenge claims of a warming ocean when he’s not personally 12,000 feet under the waves with a thermometer.
Warm water expands; that raises sea levels. No such themo-genic rise has been observed.
The temperature of the Atlantic water across the northern half of the gyre (-10 to -60 Long, 40 to 60 Lat) has been below average all year and persistently down to levels not seen since the mid 1990’s. This suggests that the Atlantic temps are about to slide to the cold half of the long term cycle and the prospects of increased Arctic ice area going forward are very good. And the (unadjusted) Global temperatures are going to drop with the change.
The North Atlantic is the major feed to the Arctic Ocean. link So it is not looking good for a major melt this year. Of course wind/storms are the major cause of fluctuations in arctic ice.
Bastardi last week analyzed this, and showed this configuration proceeds the flip of the AMO. But looking at his examples (and this one), it appeared we were flipping already to me. Anyway, (I think) he said this condition abates briefly and it looks like you’re headed back to warm, then the full flip occurs. So, we will see.
uh….precedes the flip.
The only problem I see with Joe’s analyses is that he almost never cites the Sun as important agent of climate forcing.
So far, I still don’t know what he thinks about this, but I usually learn a lot with his comments:
“This is only with a yearly AMO back off. I don’t think this is the real deal of the flip yet. But it makes the point that one can correlate the ice in the Arctic with the Atlantic cycle.“
http://patriotpost.us/opinion/25340
The AMO has been negative since the beginning of the year,
http://stateoftheocean.osmc.noaa.gov/atm/images/amo_short.gif
although NOAA is not updating the graph for some reason.
If the negative average confirms for 12 months, it’ll be the first time that the AMO becomes negative in the present cycle *since 1996*,
http://stateoftheocean.osmc.noaa.gov/atm/amo.php
1996-97 is also approximately the period when the Arctic negative anomalies started to increase systematically,
http://arctic.atmos.uiuc.edu/cryosphere/IMAGES/seaice.anomaly.arctic.png
reaching the most negative point in 2007.
hmmm….
if the waters off the coast of Africa are cooler than usual, that’s likely to have an impact on hurricane formation, isn’t it? /me goes and looks
even the NOAA thinks “maybe”, but they hedge in all directions. (unexpectedly! %-)
http://www.noaanews.noaa.gov/stories2014/20140522_hurricaneoutlook_atlantic.html
This prediction about hurricanes and the prediction of above average Arctic ice in Joe B. article above indicate that NOAA is becoming an honest teller of the truth about climate?
Where is the catch?? 🙂