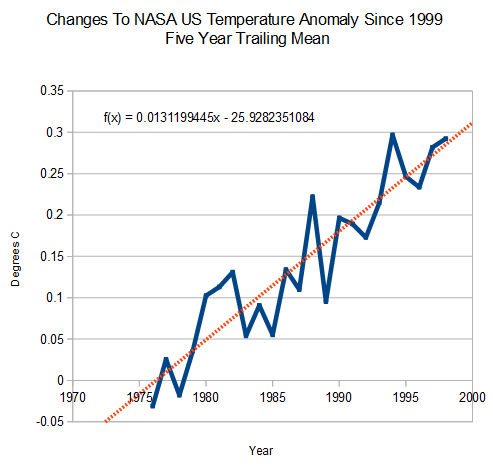
In my previous post, I showed how NASA has altered pre-1999 US temperatures relative to their previously published data.
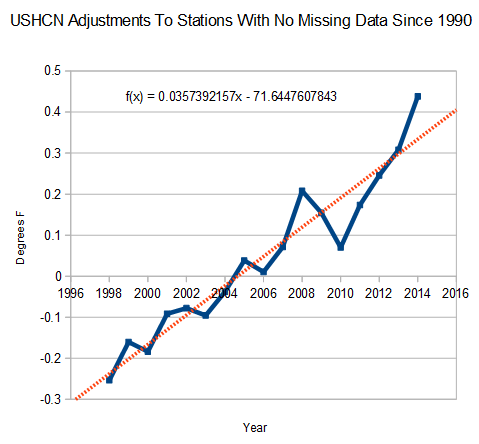
The next graph shows their current adjustments since 1998, calculated across all stations with no missing data since 1990. Their post 1998 adjustments are warming the US at 3.6F/century.


The date in the title of your first graph is wrong or the word since is wrong.
It isn’t wrong. Those are changes NASA has made to the data since their 1999 version.
A cooling climate requires bigger adjustments. If mother nature doesn’t cooperate, by dang, we will torture the data to show the needed results. Soviet style “science” at its finest!
Yes … wonder what they will be doing in the next ten years if this cooling or a ‘stable’ trend persists …
What they are doing now is massively cooling the past; using numbers that are just not physically real. There was a post here a week or so ago showing downward corrections of over three degrees in the late 19th century. Really? We know this how?
The wheels are coming off their wagon and they really have a problem if it doesn’t start getting warmer again soon.
“The wheels are coming off their wagon and they really have a problem if it doesn’t start getting warmer again soon. ”
That’s what I’m looking forward too. Unfortunately, I think they will begin to realize this and embark on some other course or tack. Don’t have any idea what that may be either.
.
They’re showing a new tact right now… blame every weather event on “Climate Change” … hammer it in on a weekly basis using your co-conspirators in the Media.. ignore the skeptics… continue to manipulate data while erasing old data so skeptics seem like KOOKS… after all .. who would dare challenge NASA or NOAA right?