I was out walking the dogs during a spectacular afternoon here in Maryland, and thinking about how incredibly corrupted the US temperature record is.
In the USHCN V1 docs, they show that TOBS (Time of Observation Bias) adjustments go flat after 1990.
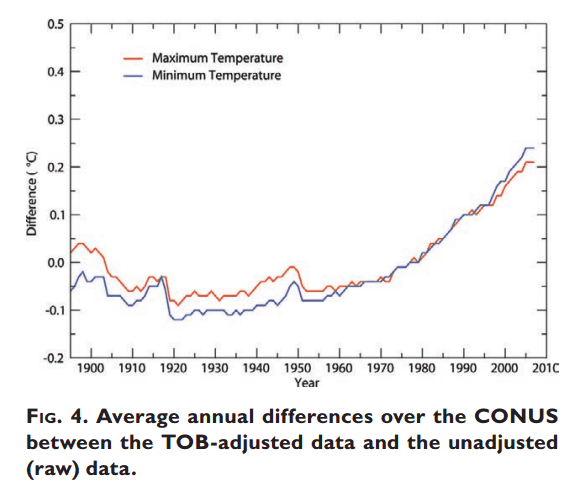
The USHCN V2 docs say that they use the same TOBS algorithm as V1, but their TOBS adjustment goes up exponentially after 1990. The same algorithm now produces warming, where it used to produce none. Junk science at its worst.
This net effect is about the same as that of the TOB adjustments in the HCN version 1 temperature data (Hansen et al. 2001), which is to be expected since the same TOB-adjustment method is used in both versions.
ftp://ftp.ncdc.noaa.gov/pub/data/ushcn/v2/monthly/menne-etal2009.pdf
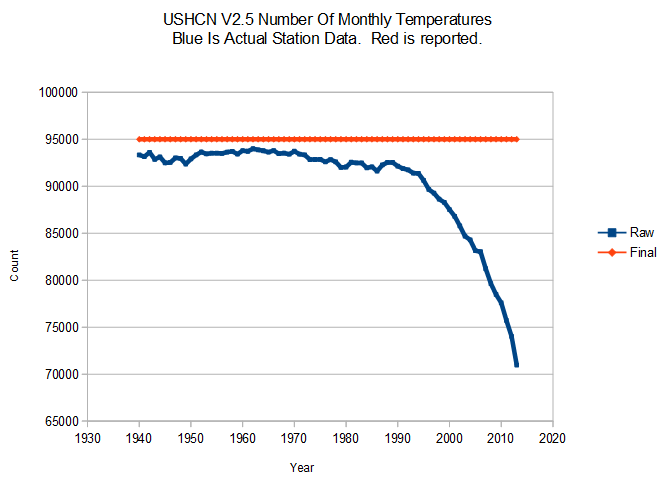
But it gets worse. Now we find out that they have actually lost 30% of their station data since 1990.
How do you calculate TOBS on an observation which doesn’t exist?
Note in the graph above that 1990 was the year when they started rapidly losing station data. It was shortly after that when their divergence from measured data started increasing exponentially.
What this indicates is that their FILNET algorithm (used to generate non-existent data) is introducing a huge fake warming bias into the temperature set. It allows them to multiply bogus TOBS adjustments, by propagating them into into fake station data.

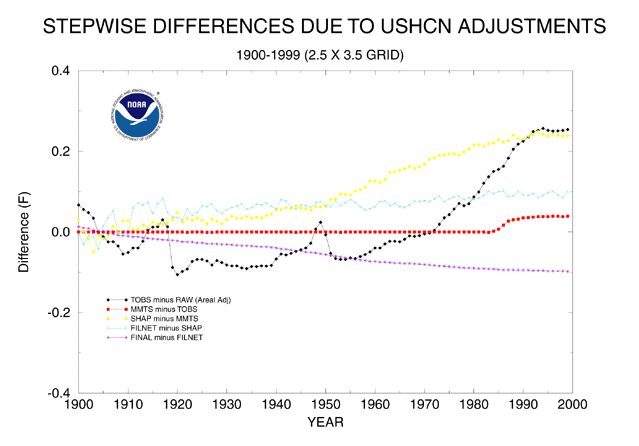
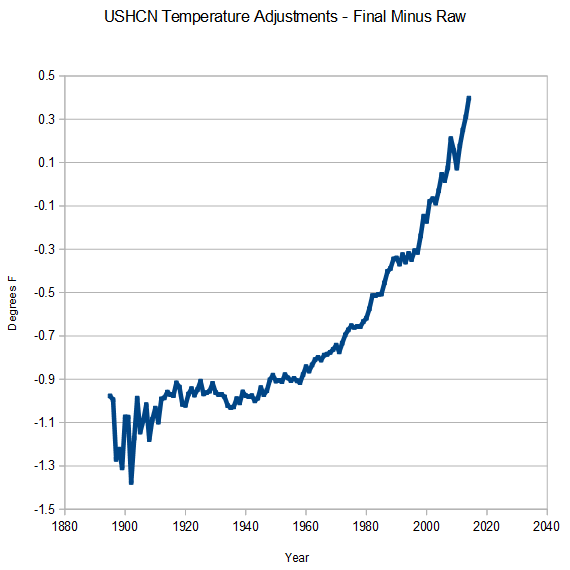
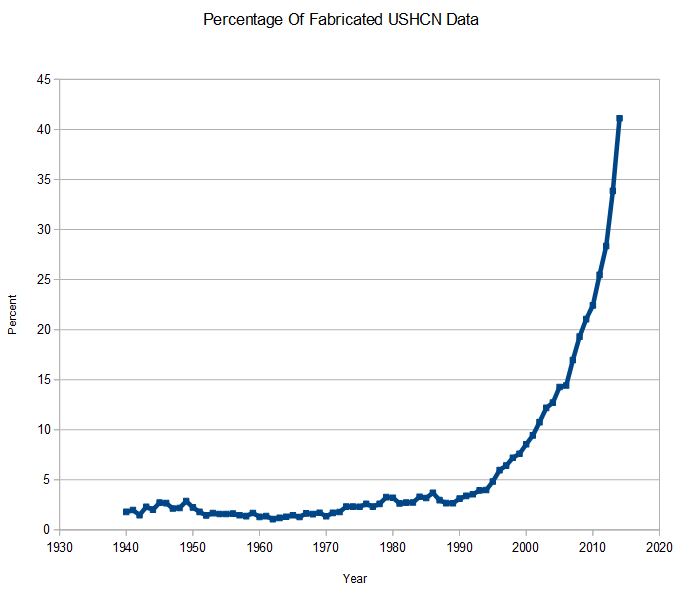

These are hockey sticks so they must be true!
~1990 is when the Soviet boogeyman collapsed, and NASA had to find a new boogeyman that wouldn’t collapse. Voila! Global warming must be confronted and destroyed, and only NASA and the UN can do it! We need them now more than ever, see?!
Why are we not surprised !? Just that they’re not smart enough to fool the ‘super-sleuth.’ 😉
I am researching climate for a series I’m writing for a small Catholic website. (I am calling the series “Climate Sanity”.)
I have noticed something about the temperature-record alterations that strikes me as peculiar.
If you look at the GLB.Ts.txt and GLB.Ts+dSST.txt files GISS publishes, going back to the earliest one that seems to be available on the Wayback Machine (Feb. 1999) and up to the latest on the GISS site (May 2014), they use 1951-1980 as the reference period, and they state that the “Best estimate for absolute global mean for 1951-1980 is 14.0 deg-C or 57.2 deg-F”. (The Feb. 1999 files says that “earlier we used 15C i.e. 59F”, though.)
In the tables that I have analyzed myself, no matter what adjustments GISS has made, the Jan-Dec Annual Mean temperature for the thirty-year span 1951-1980 always averages to 14 degrees Celsius. Always. The average starting a year earlier, or ending a year later, might vary by a hundredth of a degree or so; but 1951-1980 always averages to exactly 14 degrees Celsius.
How, and why, do they manage to do that? (I suppose the “why” is that, if they keep changing the average temperature of the reference period, what they are doing would be a great deal more obvious.)
And how can they maintain that their alterations merely remove step and trend biases if the alterations always leave the absolute average temperature of the reference period exactly the same, through fifteen years’ of alterations?
Speaking of hockey, the LA Kings win in OT vs. the Chicago Blackhawks (game 7), and will face the NY Rangers in the Stanley Cup Finals. Go Rangers!
Steve, when you say “losing stations” are you talking about “The great thermometer dying” that E.M. wrote about? – The disappearing of higher altitude locations to bias the record to the low altitude stations that remained?
If a thermometer falls by the wayside, and no one is there to read it, does it have a TOBS bias?
Why won’t an academic write an academic paper on this topic? Are they scared out of their wits of being blacklisted?
YES!
My uncle was blacklisted and I was blacklisted. (It is why I retired early) Get on the wrong side of those with power and you not only get fired, you can forget getting another job.
My Uncle never got another job and died of “Heart failure” at 56.
They would be beaten to a pulp. Figuratively, of course. But, at some level the ‘threats’ come through that something much more sinister could happen. Like no more soup. For 1 Year.
https://www.youtube.com/watch?v=M2lfZg-apSA
I once did a rough calc, and the temperature trendline globally immediately jumped about 1.5°F after The Great Dying of the Thermometers in 1990.