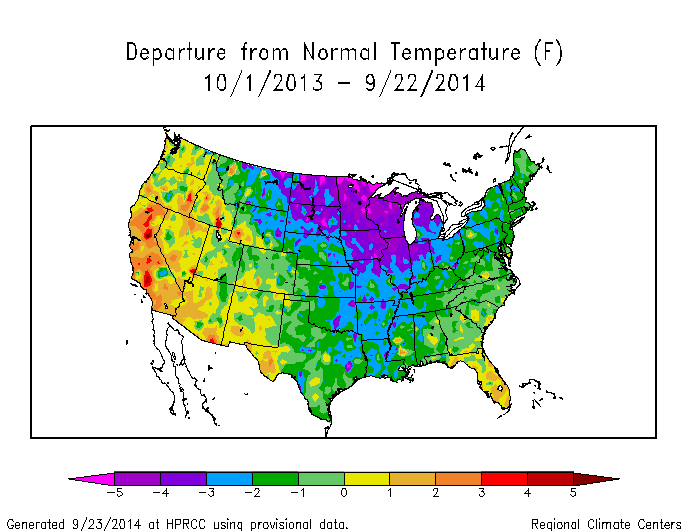
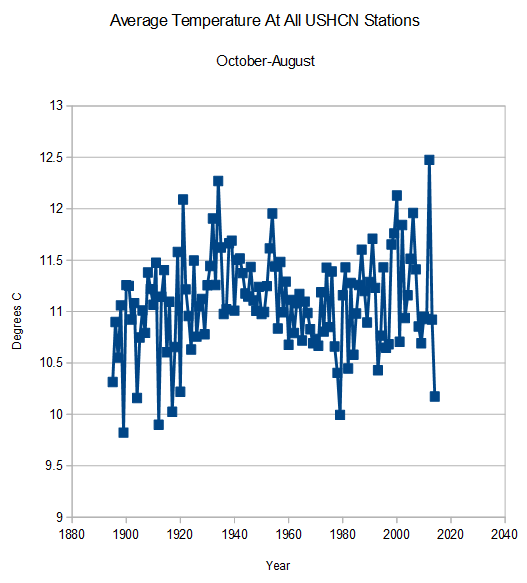
The US has been very cold over the past year.
It has been the sixth coldest October – August on record, and coldest in 35 years.
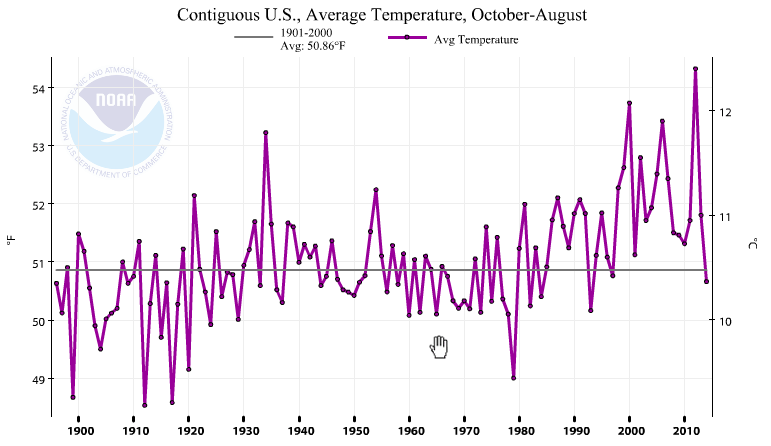
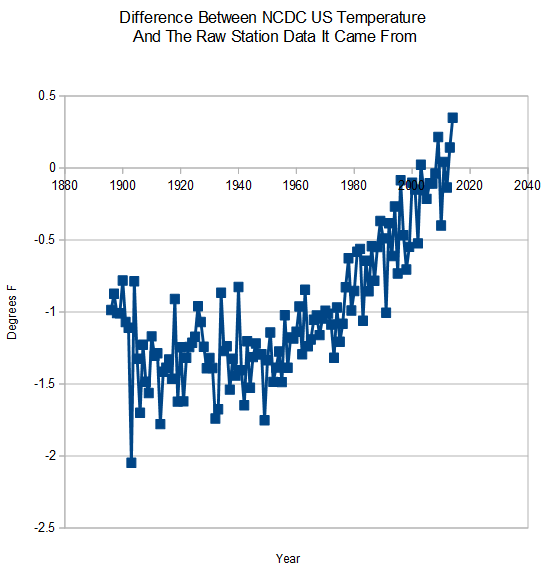
The National Climatic Data Center massively alters the data before it is released to the public, and they show October-August as just about average.
They hide the decline in US temperatures through a massive hockey stick of data tampering.
The Great Lakes had record ice this year. NCDC is lying through their teeth.
The abuse of weather data for political purposes is not a new problem. It was described as a crime against the community in 1907.


Here’s the final word from Hollywood:
“Ransom Stoddard: You’re not going to use the story, Mr. Scott?
“Maxwell Scott: No, sir. This is the West, sir. When the legend becomes fact, print the legend. ”
http://www.imdb.com/title/tt0056217/quotes
So many media personalities have publically embraced the Global Warming agenda that to change their tunes would destroy them politically. They have picked their horse and must ride on to glory…so their lies are now “fact.” Can’t back down!
Especially when, like the Piltdown Man, Eugenics, Lamarckism, Phrenology, Astrology and dozens of other pseudo-sciences, the facts prove the “science” wrong. Look at the Clintons practicing spiritualism while screaming about Nancy Reagan doing the same.
Or: 2+2=5 (else The Party falls!)
Yet to see an 80 degree night this year here in central Florida,
We’ve had a few (far East Orange County) on those day it didn’t rain but my Sycamore is already starting to lose its leaves and that doesn’t usually happen until November. All the fawns still have all their spots and they should be almost faded out by now. Temps have been pretty nice for Florida but the rain has been the killer. It’s starting earlier in the day and lasting longer this year. OMG it’s
the weatherthat dreaded ClimateChangeDisruptionSeptember is not shaping up to be any record breaker either – in reality. IN NCDC numbers, I am sure it will be.
Reblogged this on Centinel2012 and commented:
More deceit
Is it not wrong to compare graphs drawn to different scales especially when one is expressed in Centigrade and the other in Fahrenheit?
The scales are identical
We have had the warm September in UK with temperatures 15-19 Fahrenheit higher than average.
Using your analogy, your point is disproven.
Reblogged this on Globalcooler's Weblog and commented:
Some days are devoid of any good news. Today our cup runneth over.