 COI | Centre for Ocean and Ice | Danmarks Meteorologiske Institut
Disrupting the Borg is expensive and time consuming!
Google Search
-
Recent Posts
- Gaslighting 1924
- “Why Do You Resist?”
- Climate Attribution Model
- Fact Checking NASA
- Fact Checking Grok
- Fact Checking The New York Times
- New Visitech Features
- Ice-Free Arctic By 2014
- Debt-Free US Treasury Forecast
- Analyzing Big City Crime (Part 2)
- Analyzing Big City Crime
- UK Migration Caused By Global Warming
- Climate Attribution In Greece
- “Brown: ’50 days to save world'”
- The Catastrophic Influence of Bovine Methane Emissions on Extraterrestrial Climate Patterns
- Posting On X
- Seventeen Years Of Fun
- The Importance Of Good Tools
- Temperature Shifts At Blue Hill, MA
- CO2²
- Time Of Observation Bias
- Climate Scamming For Profit
- Climate Scamming For Profit
- Back To The Future
- “records going back to 1961”
Recent Comments
- Bob G on Gaslighting 1924
- Bob G on Gaslighting 1924
- conrad ziefle on Gaslighting 1924
- Bob G on Gaslighting 1924
- Bob G on Gaslighting 1924
- arn on Gaslighting 1924
- conrad ziefle on Gaslighting 1924
- Gordon Vigurs on Gaslighting 1924
- conrad ziefle on Gaslighting 1924
- Robertvd on Gaslighting 1924


Eric Worrall. over at WUWT, estimates the closing of the Drake passage in about 35 years at half the current rate of ice expansion in Antarctica. An interesting thing to ponder – what will happen when that current is cowed?
Is this even possible, with all those strong winds down there?
A more probable scenario IMO is the increasing spreading of colder sea surface anomalies to lower latitudes. In fact, this is already happening.
It definitely will not be a linear type of thing. With the currents and winds, it will be hard for ice to take hold. Some claim it happened during the past (in this ice age). But this ice age was caused by the closing of the isthmus of Panama. Do I wonder what effect the closing that passage would have.
Butt Obozo said we are all gonna fry!!
He said you could keep your doctor as well.
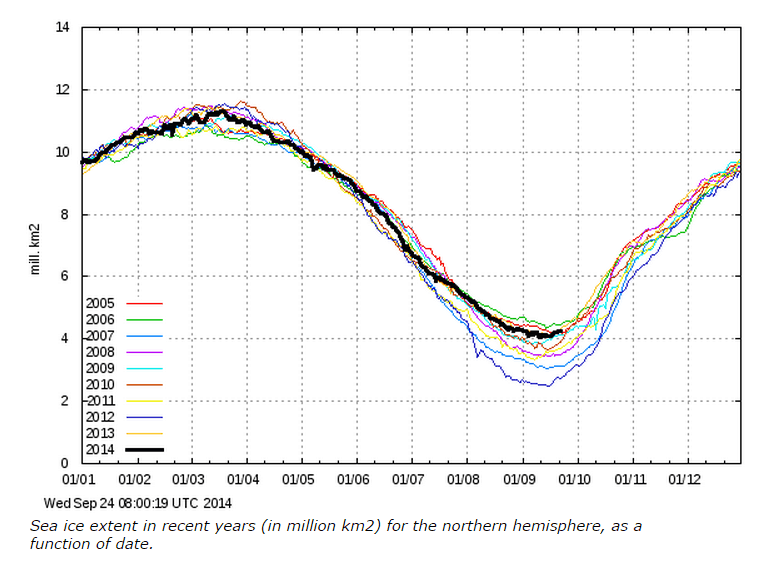
The Arctic death spiral has vanished instead of the ice.
Yeah, and it’s amazing how all the “death spiral” believers have also vanished (instead of the ice)!
Rotten ice!
the guys at the arctic sea ice forum will be so pleased the ice has not all disappeared this year 😉
It’s interesting to me how NASA is billing it. http://earthobservatory.nasa.gov/IOTD/view.php?id=84418&eocn=home&eoci=iotd_image
If you read the article they make it sound like we’re all still doomed and everything is still “way below average.” Their “average” of course starts when the ice pack was at it’s largest in 1981 to show a continual down trend rather than starting in the 1970’s when things were lower to acknowledge the potential possibility that things could be cyclical.
This looks like the place for scientific illiterates. You guys do realize that this blogger is only including six years in his data, which is not a long-term trend? You also realize that the long-term trend shows the rapid retreat of Arctic sea ice? Why read a blog by a guy who has no scientific background?
You sound like a forst rate moron
Paul you want LONG TERM?
Another paper.
A more recent paper looking at glaciers in Norway.
The authors of last paper simply states that most glaciers likely didn’t exist 6,000 years ago, but the highest period of the glacial growth has been in the past 600 years. This is hardly surprising with ~9% less solar energy.
Other data verifies these findings.
Mid to late Holocene sea-level reconstruction of Southeast Vietnam using beachrock and beach-ridge deposits
Abstract
Beachrocks, beach ridge, washover and backshore deposits along the tectonically stable south-eastern Vietnamese coast document Holocene sea level changes. In combination with data from the final marine flooding phase of the incised Mekong River valley, the sea-level history of South Vietnam could be reconstructed for the last 8000 years. Connecting saltmarsh, mangrove and beachrock deposits the record covers the last phase of deglacial sea-level rise from ? 5 to + 1.4 m between 8.1 to 6.4 ka. The rates of sea-level rise decreased sharply after the rapid early Holocene rise and stabilized at a rate of 4.5 mm/year between 8.0 and 6.9 ka. Southeast Vietnam beachrocks reveal that the mid-Holocene sea-level highstand slightly above + 1.4 m was reached between 6.7 and 5.0 ka, with a peak value close to + 1.5 m around 6.0 ka. This highstand is further limited by a backshore and beachridge deposit that marks the maximum springtide sea-level just below the base of the overlying beach ridge. After 5.0 ka sea level dropped below + 1.4 m and fell almost linearly at a rate of 0.24 mm/year until 0.63 ka and + 0.2 m as evidenced by the youngest beachrocks….
(wwwDOT)sciencedirect.com/science/article/pii/S0921818113001859
Another Sea-level highstand study shows similar findings:
Would that be the 100 year trend? Or the 200 year trend? Please support your speculation with actual data.
Why is that a single event (pick one) is enough for your side to claim doom and catastrophe, but anything that shows the opposite is ‘not long enough to be a trend’, ‘is just weather’ or any one of a hundred more lame excuses?