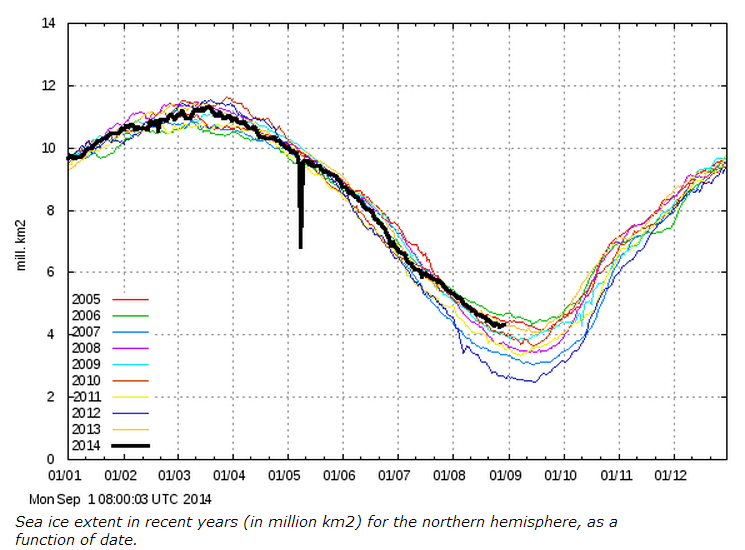
Arctic sea ice extent has not changed for a week, and is now 66% higher than the same date in 2012. It remains just below the 2006 minimum.
COI | Centre for Ocean and Ice | Danmarks Meteorologiske Institut
Arctic sea ice extent has not changed for a week, and is now 66% higher than the same date in 2012. It remains just below the 2006 minimum.
COI | Centre for Ocean and Ice | Danmarks Meteorologiske Institut
It would be nice if this was a bottom … unlikely but very, very nice.
The air temperature does not give much hope for melting:
http://ocean.dmi.dk/arctic/plots/meanTarchive/meanT_2014.png
For sunlight, the pole is still getting 24 hrs, but only ~16hrs at the edge of the Arctic Circle 66.6°N day length in the third week of each month However the sunlight is coming in at a steep angle.
The sea surface temp for August 31, 2014 doesn’t look like the oceans will be providing much melting either.
IMAGE
i wonder why we do not see the 30% sea ice extent graph on the arctic sea ice forum. you would think with the high level of interest they have ,they would have every possible piece of information available displayed .
Current wind… Maybe expand the ice
http://earth.nullschool.net/#current/wind/surface/level/orthographic=-18.19,100.76,662
Meanwhile CT Area is falling like the proverbial stone:
https://twitter.com/jim_hunt/statuses/506443853478756352
same as 2013 – up 52% from 2012 JIFOS
So David Rose’s metric de jour has not in fact “expanded for [the] second year in row”? DIFOS!
Extent and area will almost certainly end up ahead of last year. Stop lying on my blog. I’m sick of your bullshit. You are not here to have an honest discussion, and it is pathetic.
http://ocean.dmi.dk/arctic/plots/icecover/icecover_current_new.png
What do the August 25th daily data say?
-Scott
An intriguing question Scott, particularly regarding DMI extent.
To know ones great surprise I’m sure it seems that litigators and science don’t mix well.