
In order to achieve the requirements of global warming theory, NCDC simply makes up fake data to make it appear that the US is warming.
In order to achieve the requirements of global warming theory, NCDC simply makes up fake data to make it appear that the US is warming.

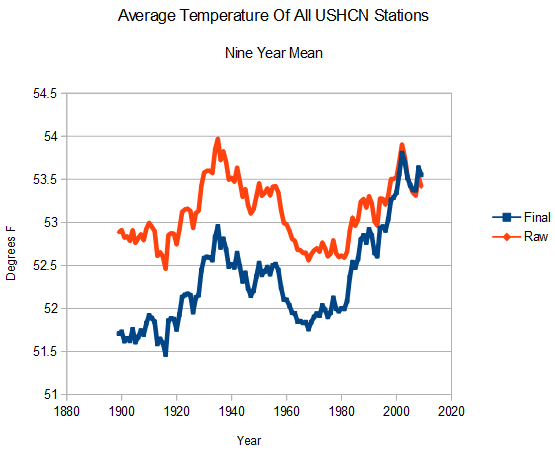
In looking at your finale vs. average USHCN chart I find the base anomaly period of 1951 to 1980 the most interesting. One would assume that the GISS global mean anomaly base never changes, as it is based on the SAME past, 1951 to 1980 period.
Now if the past anomaly basis, 1951 to 1980, is being changed, ( and they do continue to retroactively change the past, including this period) then current maps may be based against a different anomaly, even if it is the same period. (Indeed, if you were to retroactively cool that past anomaly base period, then new maps based on a different anomaly would appear warmer, relative to a now cooler past.) Which brings up a question… If they are changing the past, does the base anomaly change?
I bring this up because GISS only states that they base the anomaly on this period, but they do not specify which version of that period is being used.
thanks in advance.
Oh, here is your chart of GISS changes (sans the dates of those changes) http://stevengoddard.wordpress.com/data-tampering-at-ushcngiss/
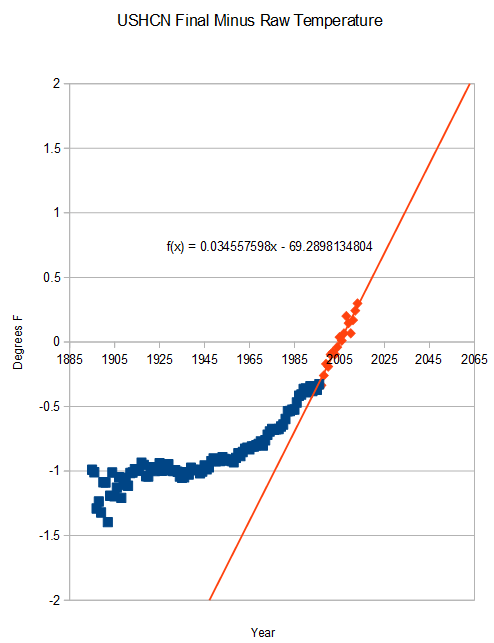
You can see how NCDC has changed the US baseline

http://stevengoddard.wordpress.com/2014/02/14/ncdc-wiping-out-americas-hot-past/
+1 Nice graphical representation of the tampering.
BOTH graphs are great at showing the tampering.
Why these people are not in jail is a real mystery. Speaking of people in Jail….
Seems at least one US Court of Appeals is finally stepping up and stomping on the use of SWAT teams to terrify ordinary citizens.
Federal Appeals Court Ridicules Florida Cops For Using SWAT Team To Check On Barbershop Licenses
The cops tried to claim immunity from prosecution for doing their jobs.
About time. Maybe sanity is starting to reappear – FINALLY!
Yes, I see that, However it does not answer what baseline is used globally by NASA GISS for 2014 maps vs say 1998 maps.
By the end of the century we won’t even be expecting another ice age. With enough adjusting, we can all live in a perpetual summer, ignoring the glacier as it moves across our Arizona homestead.